fitness testing framework tutorial

Benefits: What You Get

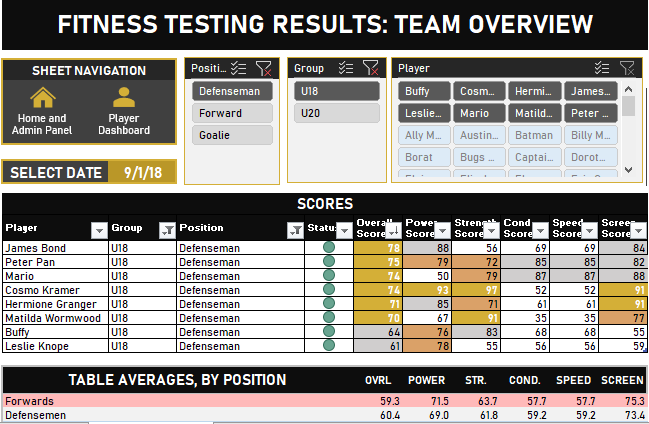
Interactive Dashboard

An insanely dynamic and interactive dashboard; data-driven insights into fitness testing results can be made, including comparison between positions, cohorts, and deep-dives into an athlete's strengths and weaknesses.

Undiscovered Excel

Exposure to many little-known and underutilized Excel features and time-saving tricks.

Knowledge and Skill

A ton of real-world knowledge for data management, organization, and display while developing your software and Excel skills.

TO GET ACCESS TO ALL VIDEOS, FILES, AND OTHER PIECES OF RELEVANT CONTENT, ENROLL IN THE TEAM FITNESS TESTING FRAMEWORK COURSE.

First Things First

Download the data set by clicking the button below so that you're ready to follow along with the videos.

THE TUTORIAL VIDEOS

This is how the final Microsoft Excel file output from this fitness testing framework tutorial series works. In this video, I give a broad overview of the different components. In the next two videos, I go in more depth into each of the components outlined. I strongly encourage that you check out the course for this tutorial; in addition to a streamlined learning experience, you get a new Excel file after each video, plus the final output file.

We discuss how the data entry and visualization components will work after completion of the tutorial.

In this video, I go over how the customized metric weighting and category scoring works. These components will separate this tutorial from anything you’ve ever seen before. Enjoy!

In this video, we go over our dataset, fitness testing intricacies, and form a few tables out of our data.

In this video, we create calculations inside of our fitness testing database to compute average and “best” values for when multiple trials of a test are performed. We also discover how to connect tables to one another.

In this video, we go over our plans for which data to display. We also discuss the necessary filters and interactions to make it a dynamic, informative experience that allows us to make meaningful decisions. It’s always good to have a plan, even if we don’t follow it to a “T”!

Spoiler alert: This plan doesn’t really come to fruition.

In this video, we begin setting up a framework that will allow us to specify the rangers of “good” and “bad” performance for each metric, and cohort, of interest. We start with standard deviations (e.g., Z-Scores) and set up our framework so that we can change the number of Z-Scores on the fly. Later, we will add the ability to change our criteria from Z-Score to arbitrary value cutoffs or maximum and minimum metric values in the data set.

In this video, we add the ability for the user to set up “good” and “bad” performances based on user-defined (e.g., arbitrary) cutoff values or the maximum and minimum values for each metric.

For example, the user could say that anyone who jumps over 24 inches gets the best score possible, or the user can set the best score possible to the maximum vertical jump value observed, which could be 30 or more inches. In the previous video, we learned how to set up criteria based on standard deviations (Z-Scores); the user can now choose between these three scoring methods, for each metric.

In this video, we set up an incredibly dynamic scoring system that automatically gives athletes values from 0-100 for each test. We go over how to use the ability to control the range of scores you’d like to give; it can be between any two numbers, such as 30-100, 100-1000, etc. You have total control!

This video is exclusive to students who have enrolled in the full Team Fitness Testing Framework course.

In this video, we connect our custom scoring criteria to the raw values for each test/metric within our database table so that we can use the metric scores in our dashboards efficiently.

In this video, I fast-forward through completing the steps that we went over in the last video (#7). It took me 20 minutes to complete, but at 10x speed, I set a world record and did it in 2 minutes!

In this video, learn how to give each of our metrics a weighting that determines their contribution to a category score (e.g., countermovement jump and Wingate peak power may each contribute to a “power” category score).

We also learn how to organize our metrics into their appropriate categories and assign each category a unique weighting contribution towards an “overall” score. In the end, we’re dealing with a bunch of scores instead of the metric values, which can be easier for stakeholders to digest when it comes to fitness testing results.

In this video, we discover different methods of treating athletes’ scores when they did not complete all tests; we can give them a 0 value for the test or automatically re-configure their score without the missed test counting against them.

For example, if we had a “power” score that was made of vertical jump and long jump tests, but an athlete did not perform the long jump test, we figure out how to automatically disregard his or her long jump score, which would have normally had been a 0, and ultimately resulted in a deflated overall score.

This video is exclusive to students who have enrolled in the full Team Fitness Testing Framework course.

In this video, we start visualizing our data by creating a table to house our fitness testing results in our soon-to-be interactive dashboard. You will see how dynamic this table can be, including its ability to filter our other dashboard components, including charts and graphs.

In this video, we go over different conditional formatting (e.g., automated coloring based on rules) options and apply formatting to our table.

In this video, we expand upon the conditional formatting that we reviewed in the previous video (#12); we apply a more advanced style of conditional formatting using custom rules.

In this video, we set up a framework that will allow us to dynamically interact with our graphs and charts in our dashboard.

In this video, we create graphs and charts that will go into our interactive team fitness testing dashboard using the framework that we build in the previous video (#14).

In this video, we calculate group averages per metric and make our dashboard look nice. We also organize our dashboard layout and create dynamically-updating drop-down lists to make the user interaction experience a good one.

This video is exclusive to students who have enrolled in the full Team Fitness Testing Framework course.

In this video, we briefly review how to freeze panes to enhance your interactive experiences with the dashboard. This is the final video of the Team Fitness Testing Framework series; congratulations on your accomplishments!

If you want to take this dashboard to the next level, check out the LEVEL-UP videos where we build dynamic charts that can be manipulated by actions we take in our table.

In this video, we begin to set up a framework that allows us to create charts that are both filterable by our main fitness testing table and also enables us to select the metric of interest from that table.

In this video, we complete our framework for setting up the filterable and metric-dynamic bar charts from the previous video and put them on our dashboard. We also add some flare to the charts and briefly review a few charting features.

This video is exclusive to students who have enrolled in the full Team Fitness Testing Framework course.

In this video, we add lists of top and bottom performers based on the metric we select to compliment our charts created in the previous LEVEL-UP videos.

.
In this video, we flip our bar charts from being vertical to horizontal bars and discover how to create an average (e.g., vertical) line in our chart; it’s not as simple as you think!

STAY TUNED FOR MORE VIDEOS. I WILL BE RELEASING A FEW NEW VIDEOS EACH WEEK, BUT NOT ALL VIDEOS WILL BE PUBLICLY VIEWABLE.

TO GET ACCESS TO ALL VIDEOS, FILES, AND OTHER PIECES OF RELEVANT CONTENT, ENROLL IN THE TEAM FITNESS TESTING FRAMEWORK COURSE.

If this experience helped you or if you have any questions, let me know! Connect with me on social media or send me an email to share your experiences.

Let's Keep In Touch!