
Exclusive Spreadsheets and Tutorials
**Only Silver and Gold Level Members have access to these tutorials and spreadsheets**
Free Spreadsheets and Tutorials
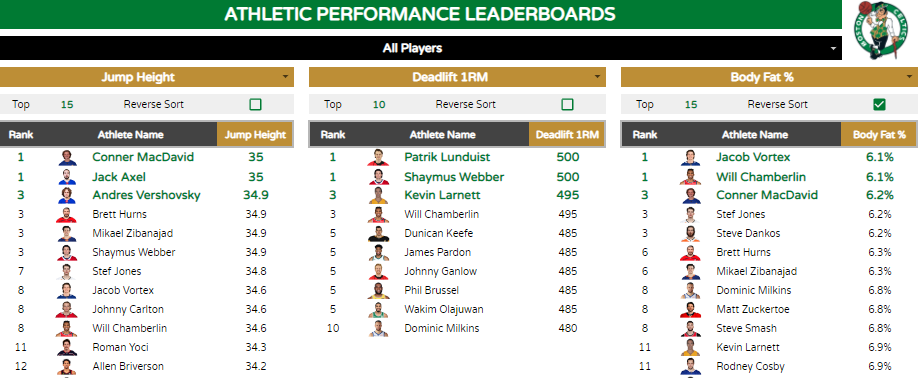
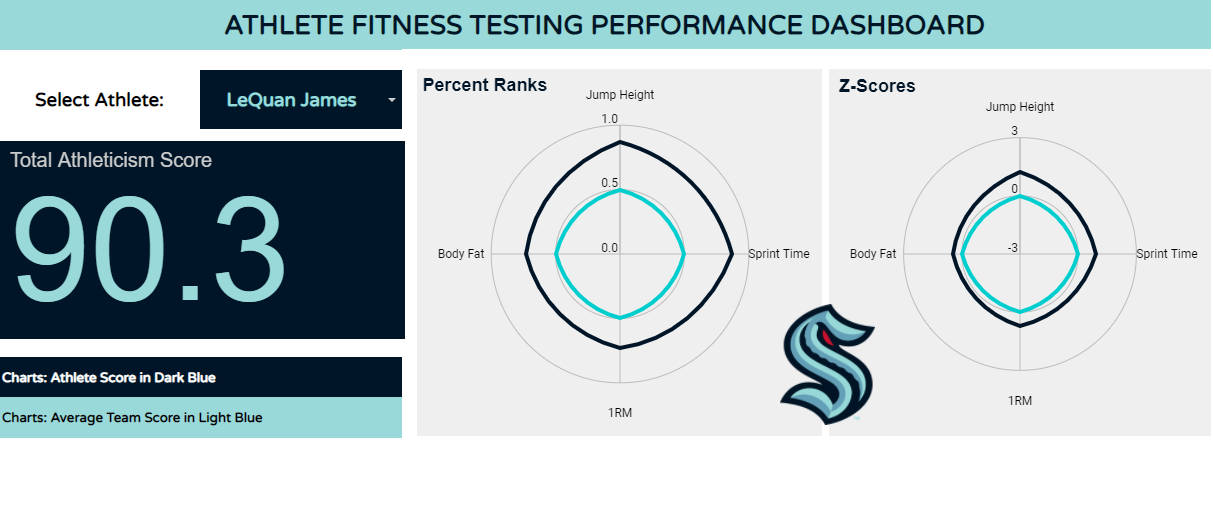
In this video series, we build an advanced fitness testing framework and dynamic interactive dashboard in MS Excel. We set up an entirely custom scoring system whereby we can assign each fitness test an automated “score” based on Z-Scores, maximum and minimum values in the dataset, or arbitrary values that we choose. We also compilate these test scores into categorical scores (e.g., speed, power, strength conditioning), and ultimately, learn how to generate an automated “overall score” based on our desired weightings.
- 17 tutorial videos
- 4 “level up” videos
- Estimated watch time: 10 hours, 30 minutes
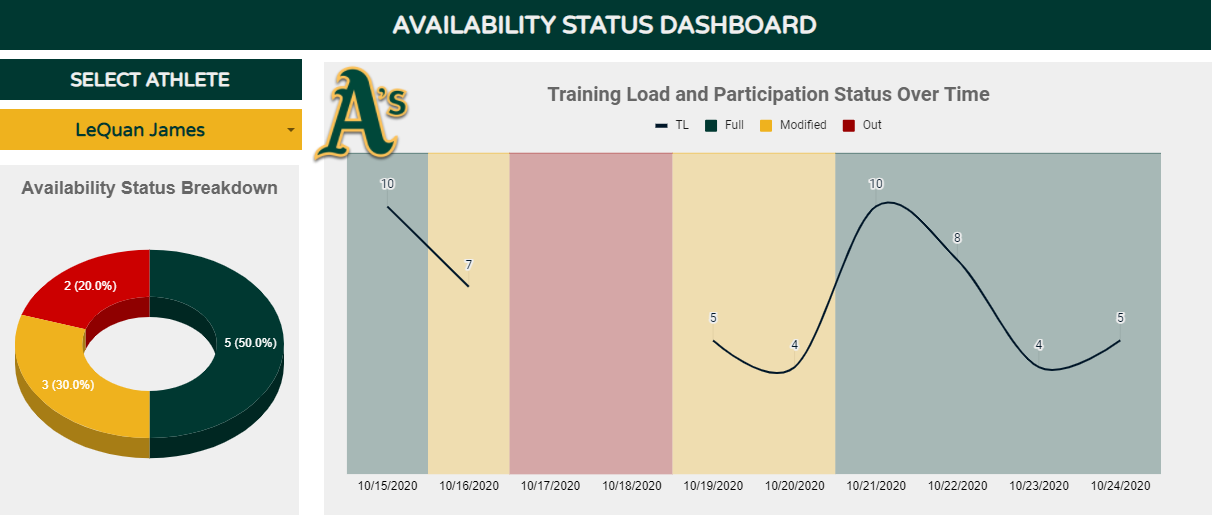
In this tutorial, you learn how to build a dynamic, interactive player performance and monitoring dashboard in MS Excel, from scratch!
- 13 tutorial videos
- 4 “level up” videos
- Estimated watch time: 6 hours, 30 minutes
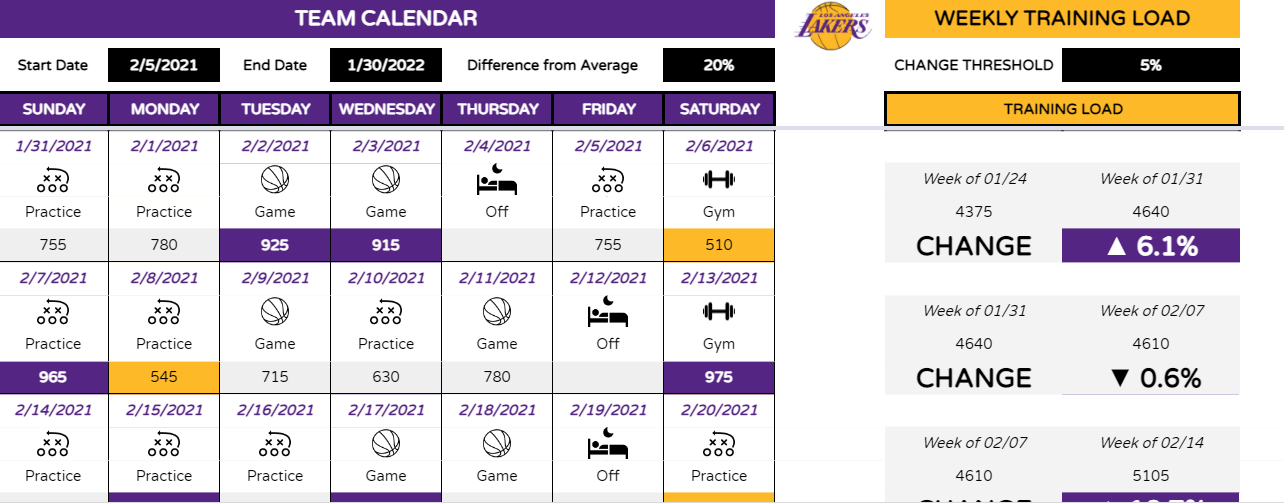
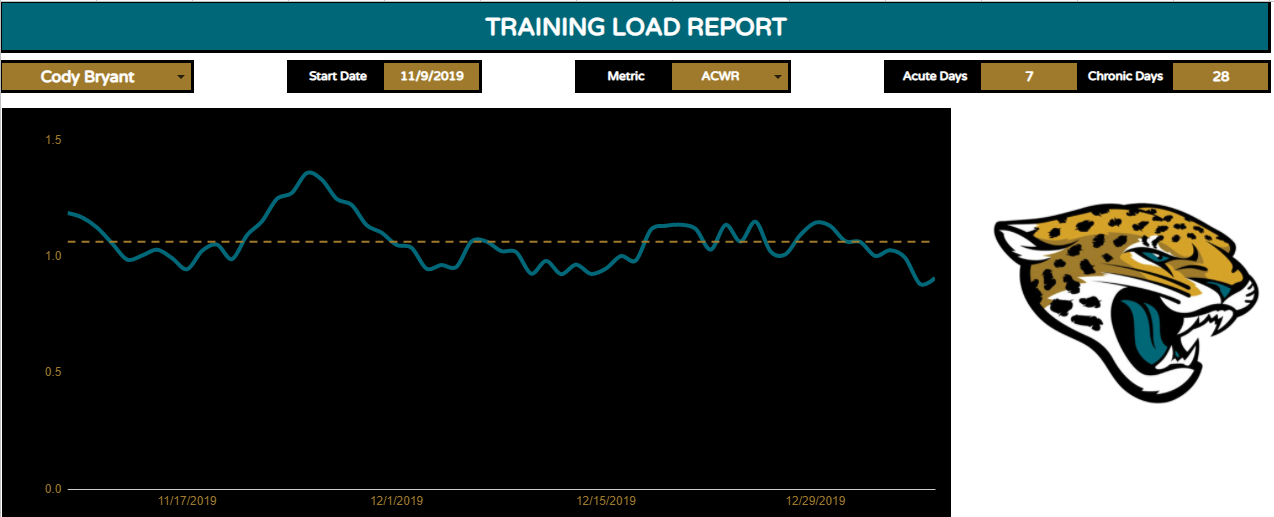
In this tutorial, you learn how to build a dynamic, interactive team performance and monitoring dashboard in MS Excel, from scratch!
- 11 tutorial videos
- 3 “level up” videos
- Estimated watch time: 4 hours, 30 minutes
In this video, we first build a dashboard in MS Excel to monitor a single key performance indicator (KPI) metric by comparing athletes’ current performances with their all-time best. We use vertical jump height as the KPI, but any metric (where an increase in the metric is akin to better performance) will suit. Then, we take it to the next level and allow ourselves to change the metrics, whether it be jumping, sprinting (where a decrease is akin to better performance), or weightlifting performance.
- 1 tutorial video
- 1 “level up” video
- Estimated watch time: 1 hour, 30 minutes
In this video, we build an interactive shot chart in MS Excel using X-Y shot coordinates from a dataset from a software program used by teams in the National Hockey League (NHL). The dataset includes all goals and shots on goal for all players during the 2015-16 NHL season.
- 1 tutorial video
- Estimated watch time: 45 minutes
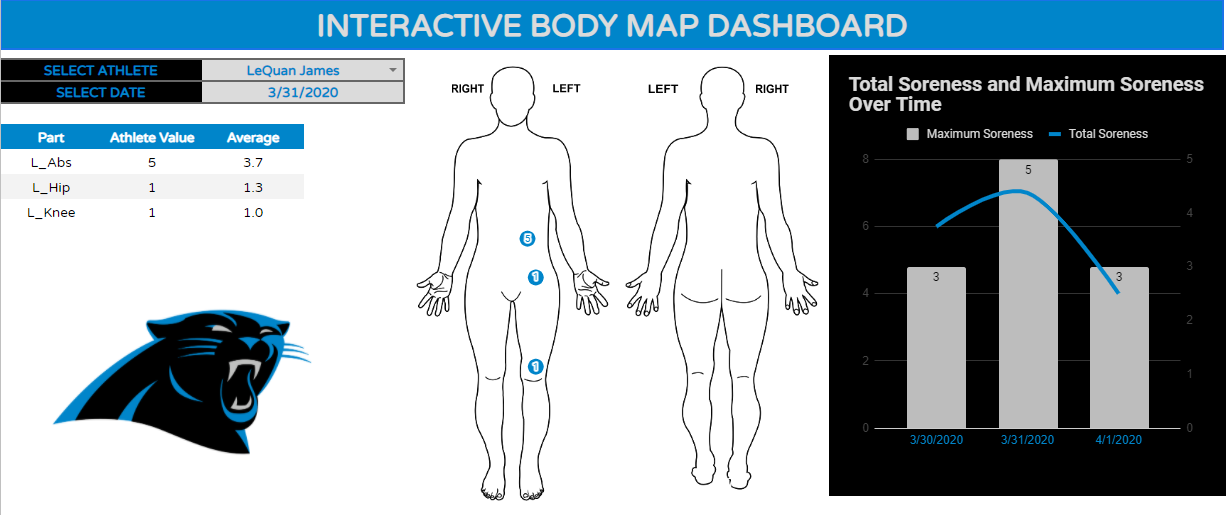
In this video, we build an interactive body map using longitudinal pain (or soreness) data for a group of athletes in MS Excel.
- 1 tutorial video
- Estimated watch time: 55 minutes
This is a free MS Excel product that enables you to better organize and sift through research you’ve read.
To download the file for free and discover how it can help you, go here.
This is a free MS Excel product that enables you to longitudinally analyze force-velocity profiling data and make comparisons between athletes.
To download the file for free and discover how it can help you, go here.
This is a free Google Sheets product that enables you to longitudinally analyze force-velocity profiling data and make comparisons between athletes.
To download the file for free and discover how it can help you, go here.
PRODUCTS
Check out my affordable products to bring your game to the next level.
CONSULTING
If you need consult, I'm here to help. The first call is free, and it's easy to schedule.
YOUTUBE
I have additional tutorial and educational videos on YouTube.
Got Questions?
Feel free to connect with me personally on social media or via email if you want to learn more.