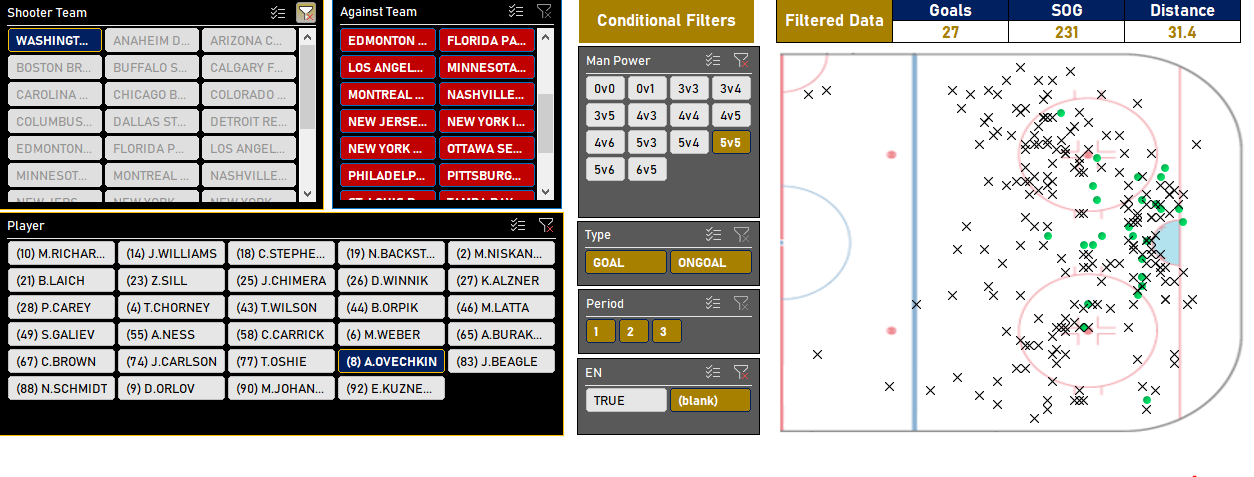
An insanely dynamic and interactive shot chart dashboard. Regardless of sport, this dashboard will work for you if you have shot location X-Y coordinates.
Undiscovered Excel
Exposure to many little-known and underutilized Excel features and time-saving tricks.
Knowledge and Skill
A ton of real-world knowledge for data management, organization, and display while developing your software and Excel skills.
IF YOU WANT THE FINAL EXCEL FILE OUTPUT FROM THE SHOT CHART TUTORIAL, IT IS AVAILABLE ON THE PRODUCTS PAGE.
First Things First
Download the data set by clicking the button below so that you're ready to follow along with the videos.
we create an incredibly interactive shot chart in Microsoft Excel. We do this using the X-Y coordinates of shots on goal and goals during the 2015-16 NHL season. You can apply this framework to any sport, so long as you have shot location X-Y coordinates.
If this experience helped you or if you have any questions, let me know! Connect with me on social media or send me an email to share your experiences.