
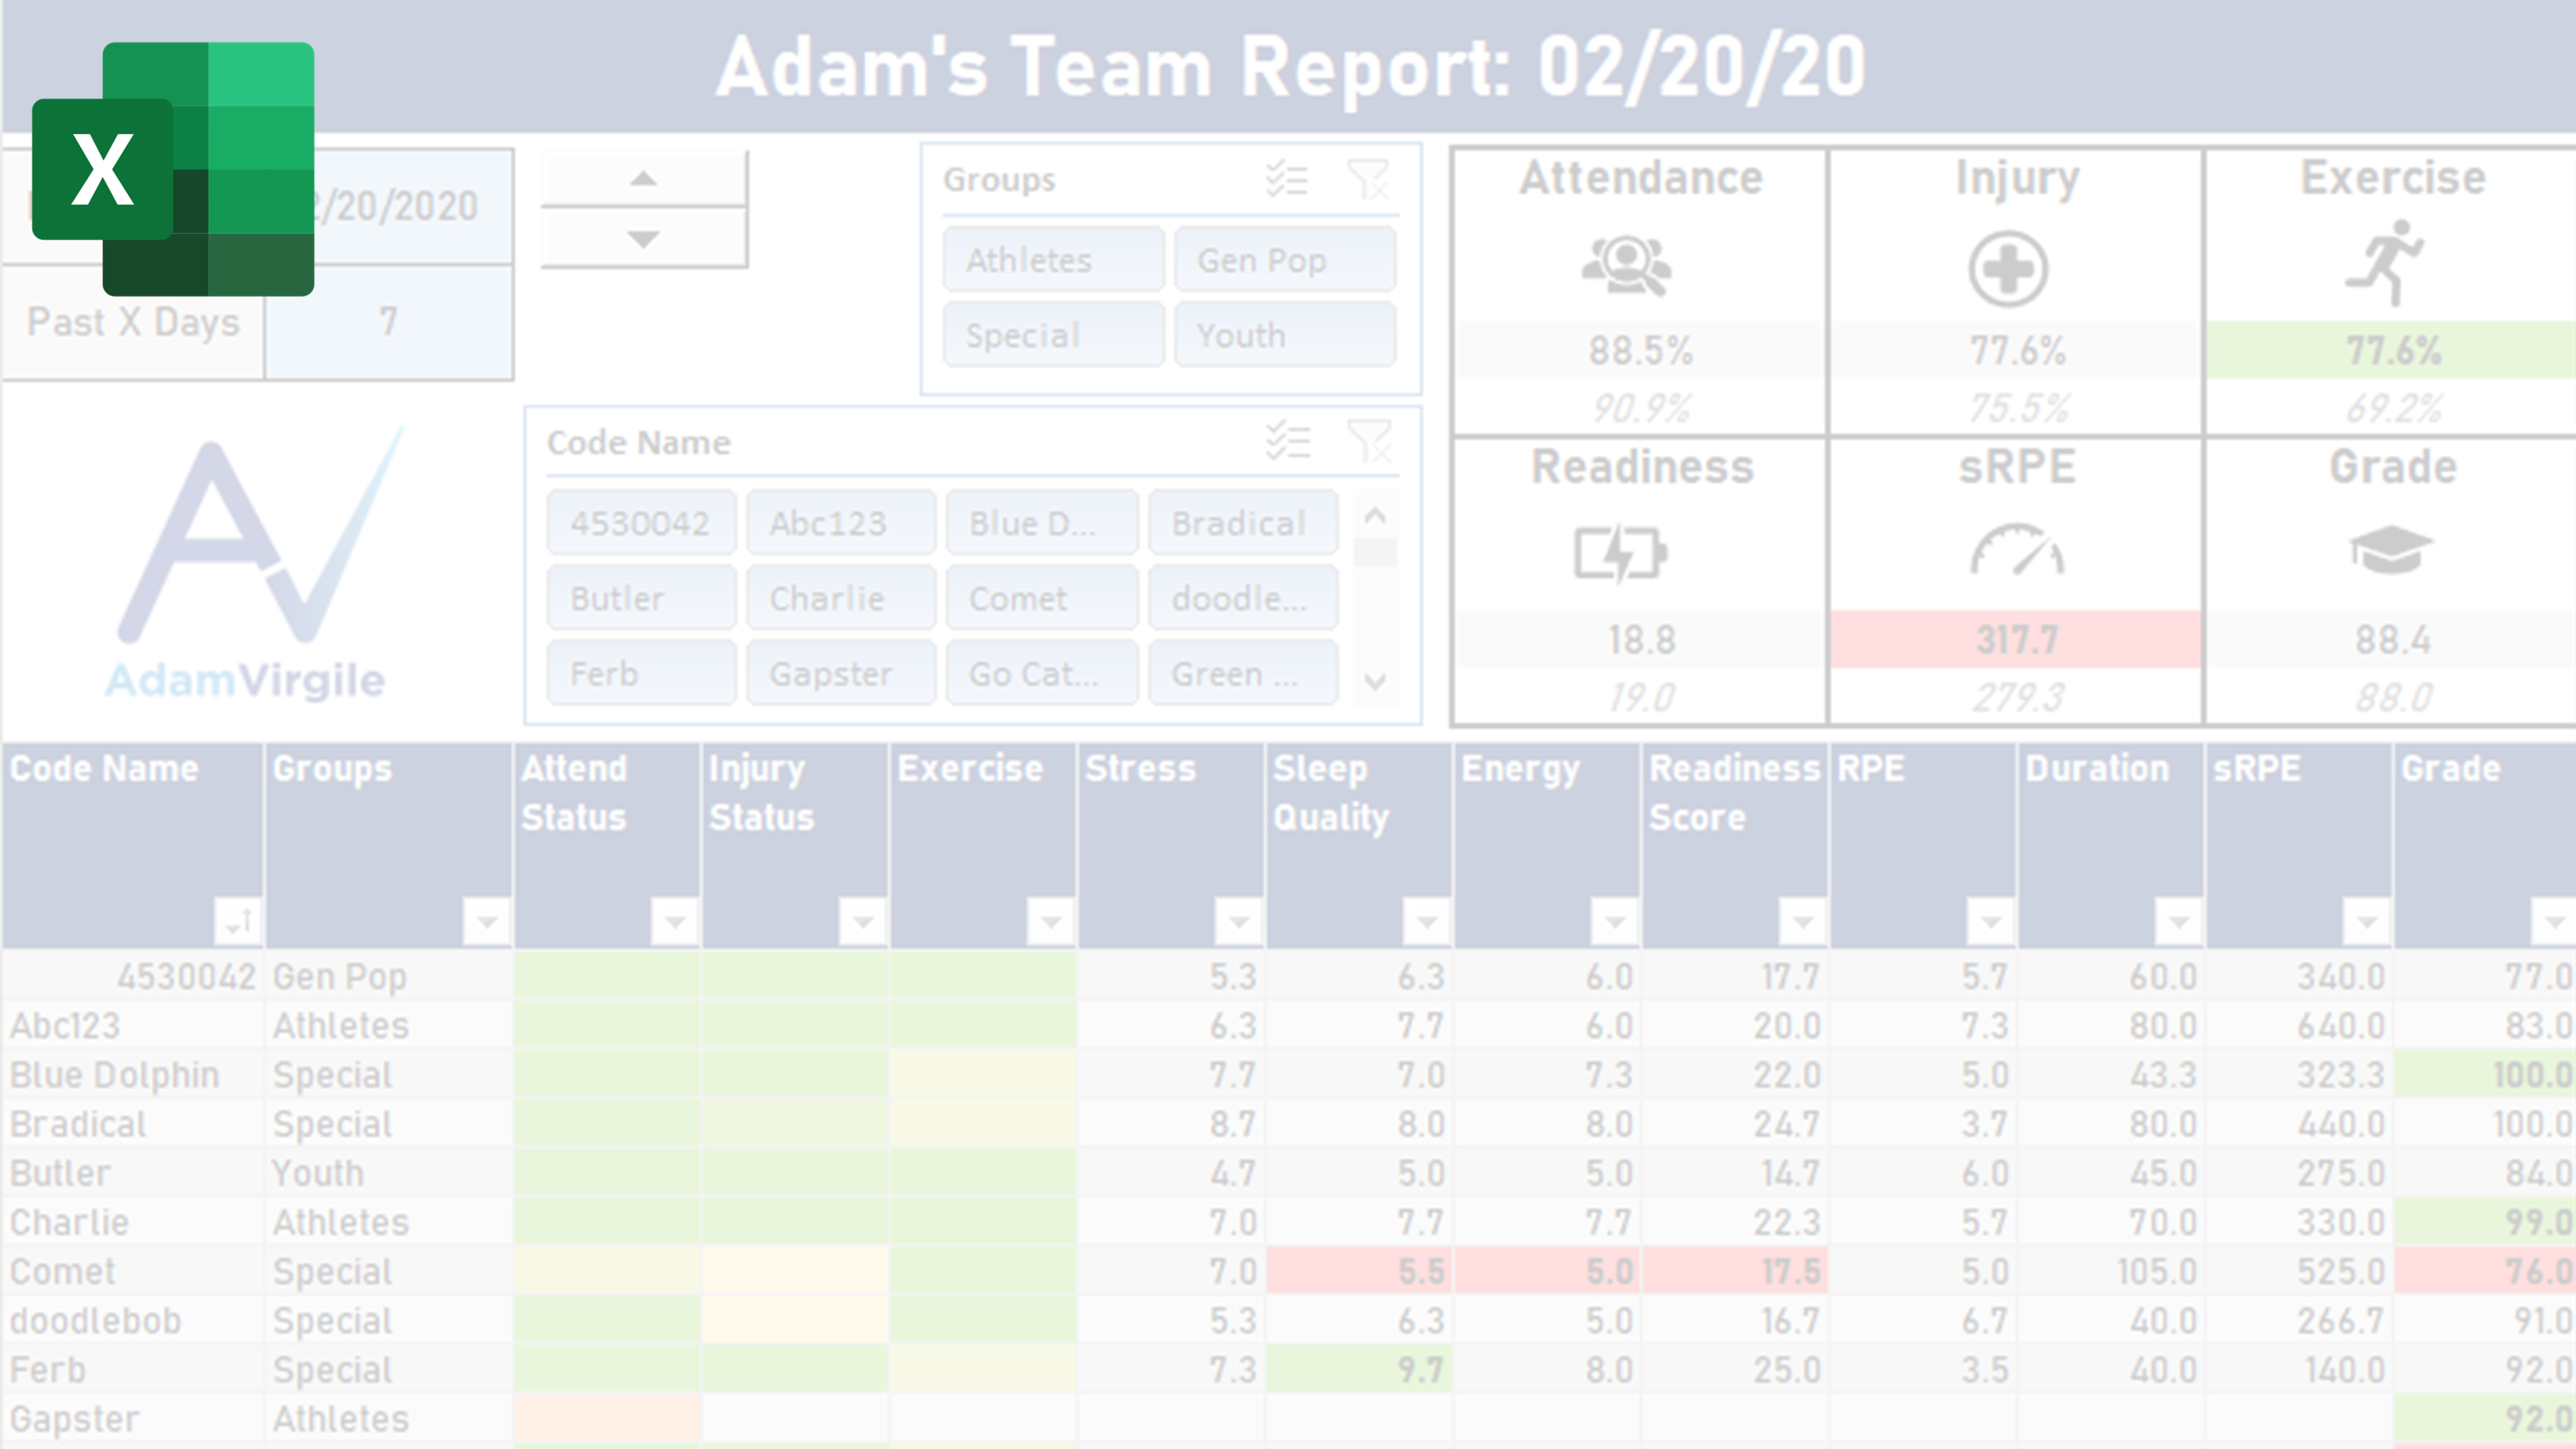
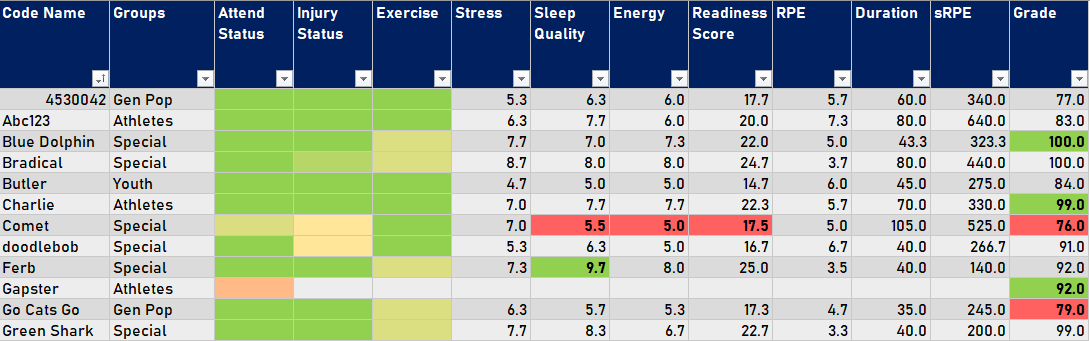
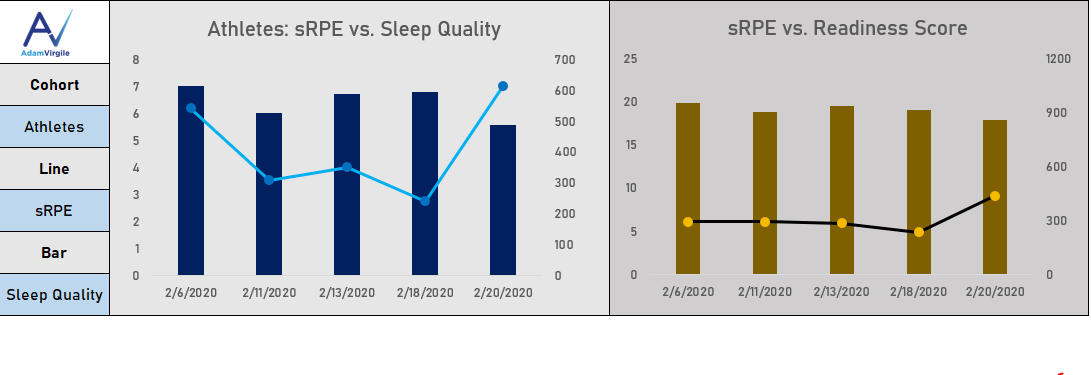
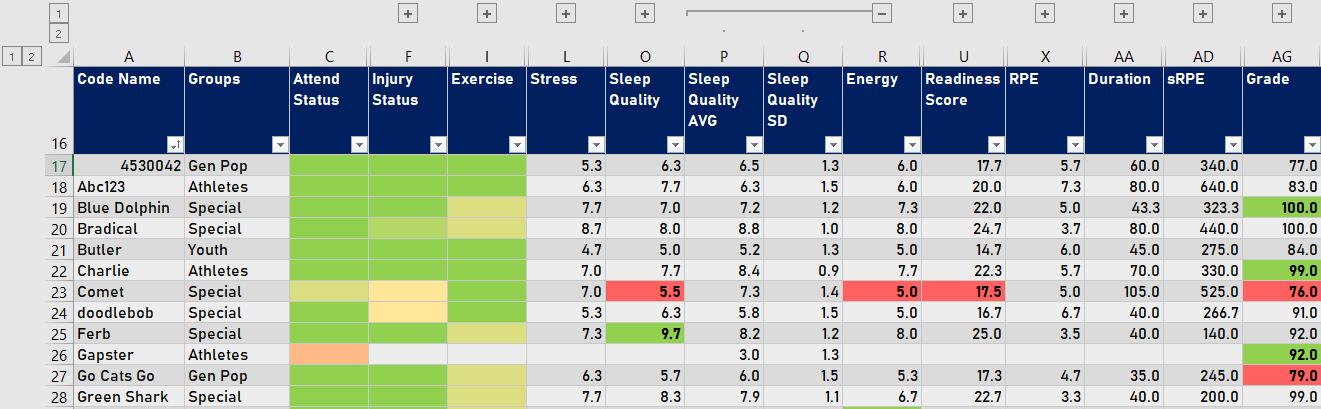
Ultimate Team Dashboard
$59.99
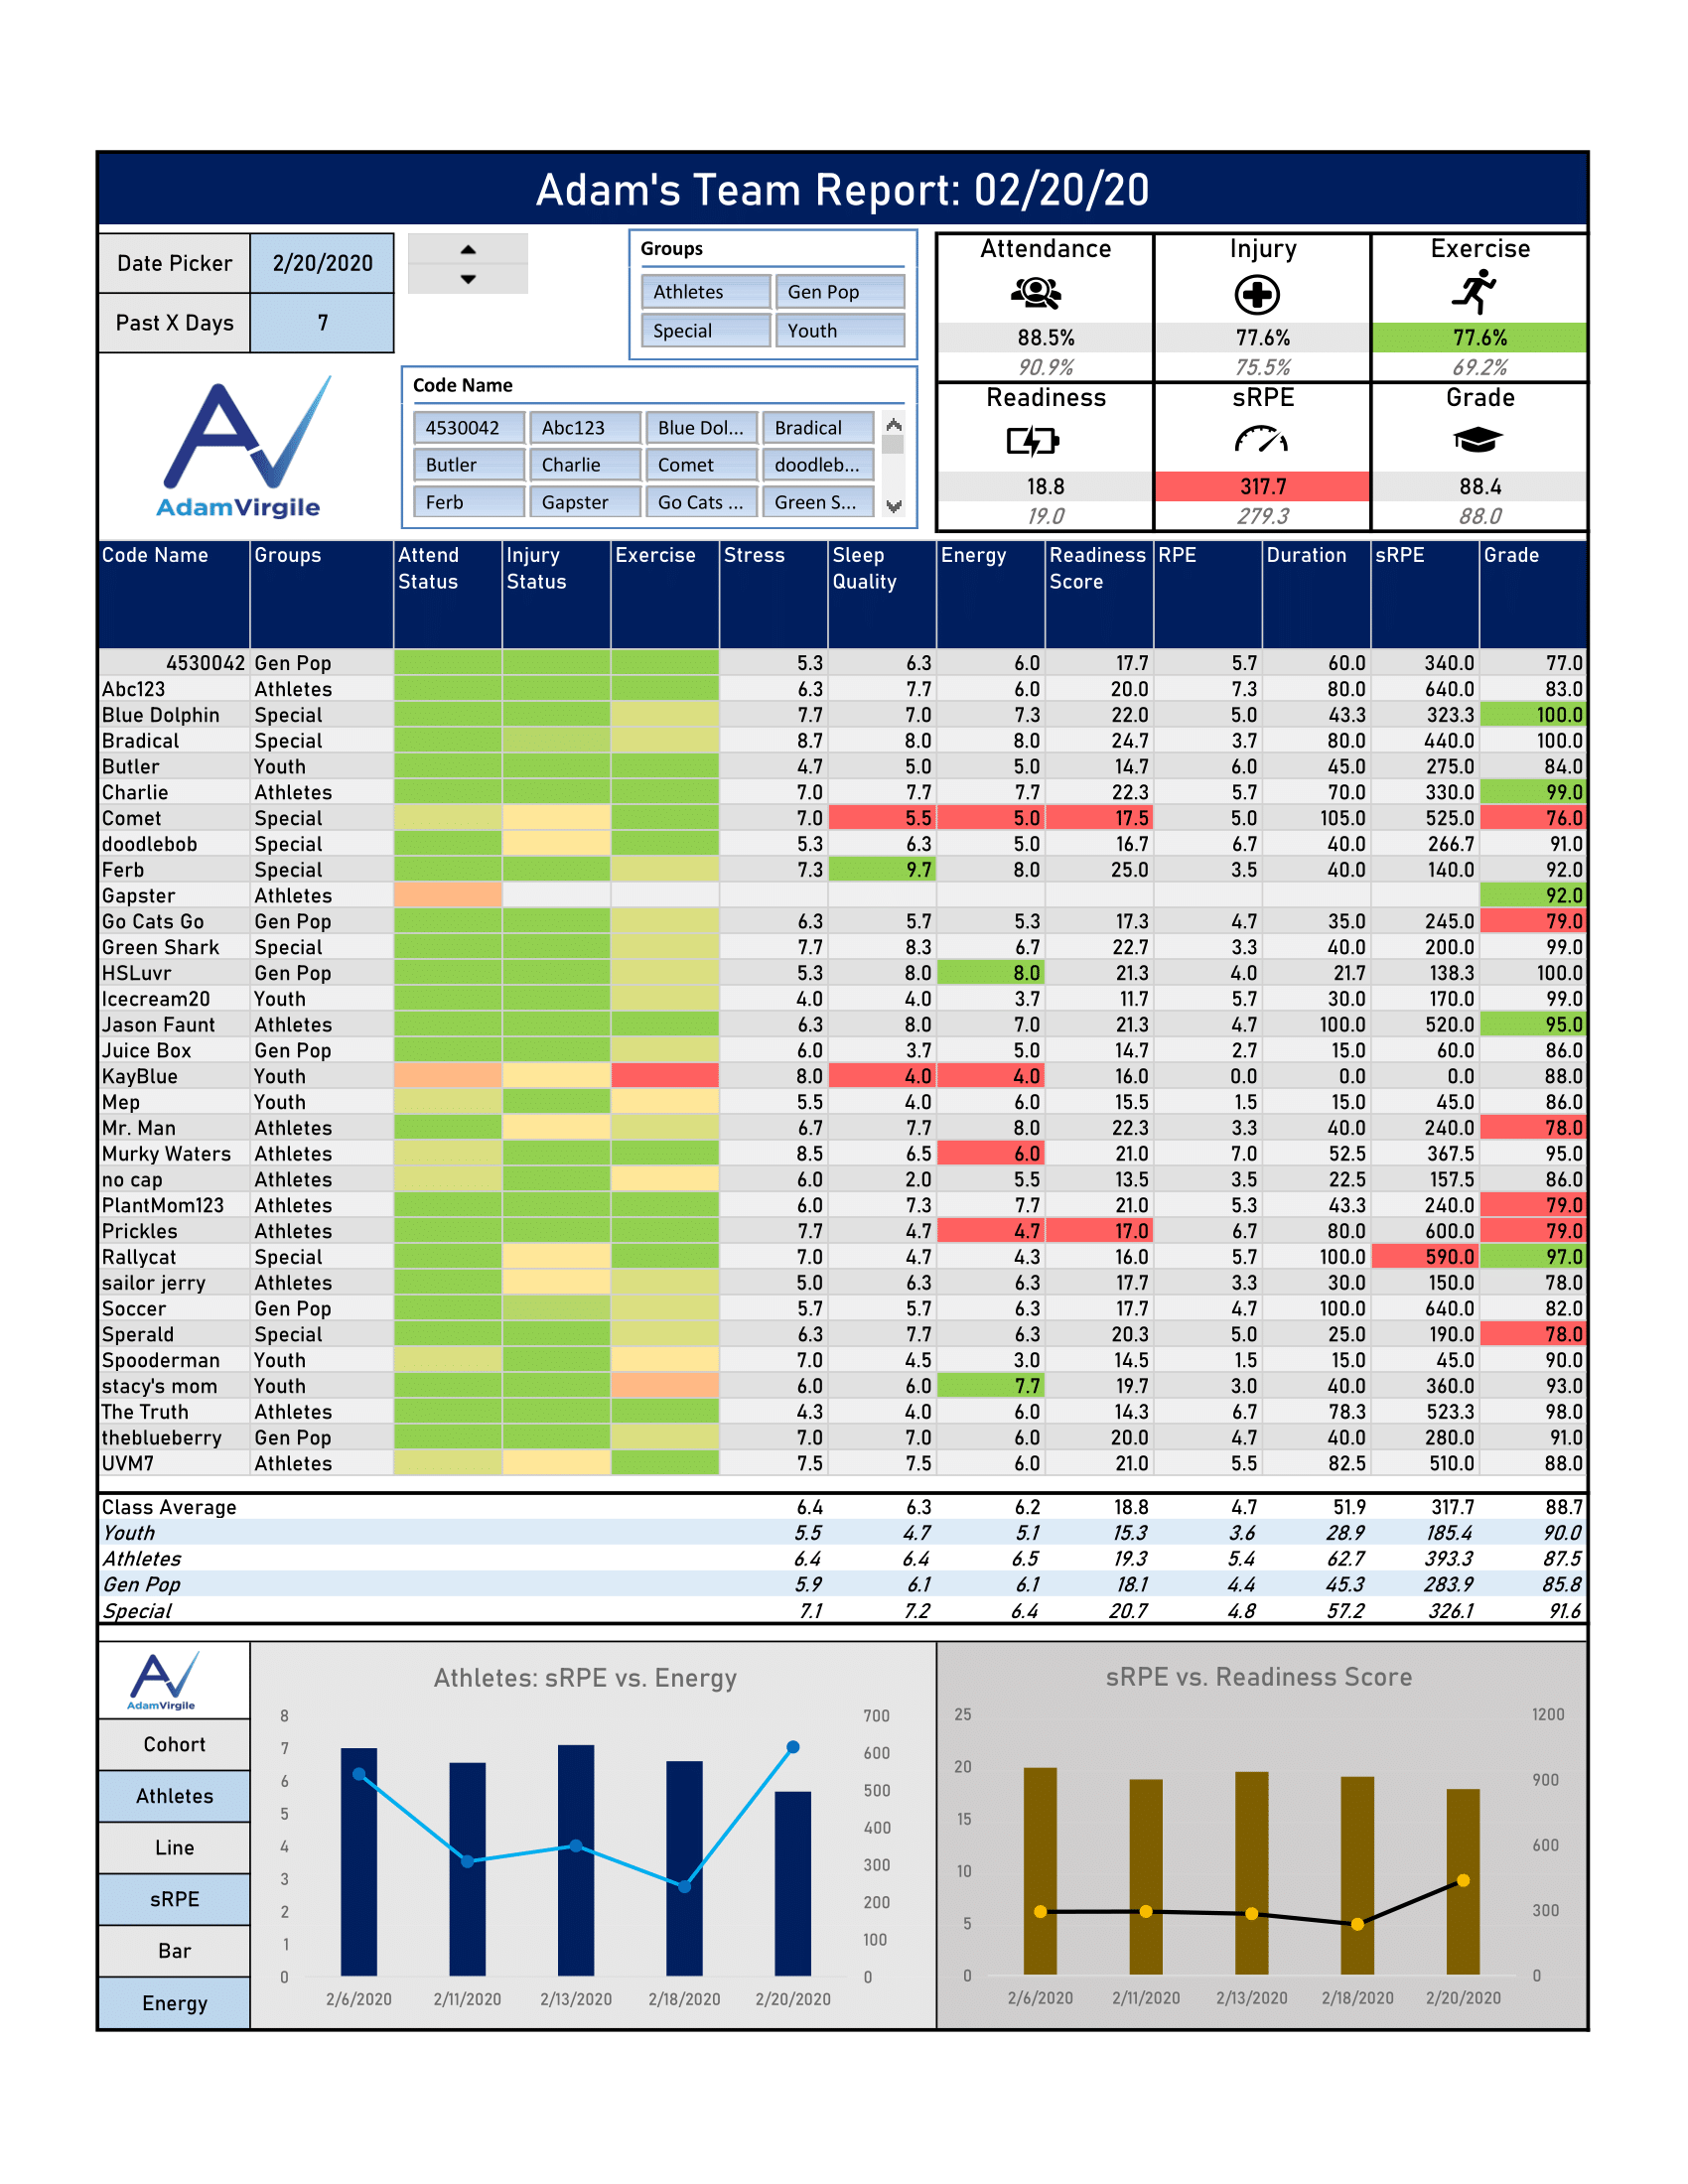
With this purchase, you will receive the final Microsoft Excel (.xlsx) file that is created after completion of the Ultimate Team Dashboard video tutorial series. For more details, please view the product description.
To see the full product description, you must be a member). Gold and silver members receive significant product discounts, as well. Already a member? Please login. You must be logged in to view the full product description, which may contain important pieces of information about this product.