Monitoring body composition in athletes is beneficial for a multitude of reasons. Although ultrasound (US) is not typically known for its potential to assess body composition, this technique may be a diamond in the rough for body composition assessment in athletes and sport. How it works, its popularity among sport professionals, and common sources and margin of error are reviewed in this article.
Grey boxes are summary points
Blue boxes give more detail about key terms or subjects
History and Popularity
Most people are familiar with the biomedical diagnostic application of ultrasound (US), such as musculoskeletal injury evaluation and visualization of a fetus during a prenatal exam [1]. Despite being used to measure fat thickness in humans dating back to the mid-1960s [2, 3], using ultrasound for body composition assessment has been customarily overshadowed by other techniques [1]. In a recent survey of national and international sport professionals by Meyer et al. (2013), ultrasound (US) was so seldom used that it didn’t even make the list of common body composition techniques [4]. On the other hand, skinfolds assessment, a technique that provides many similar advantages to US (small, portable, quick, regional assessment, etc.), was the most popular kid in class [4].
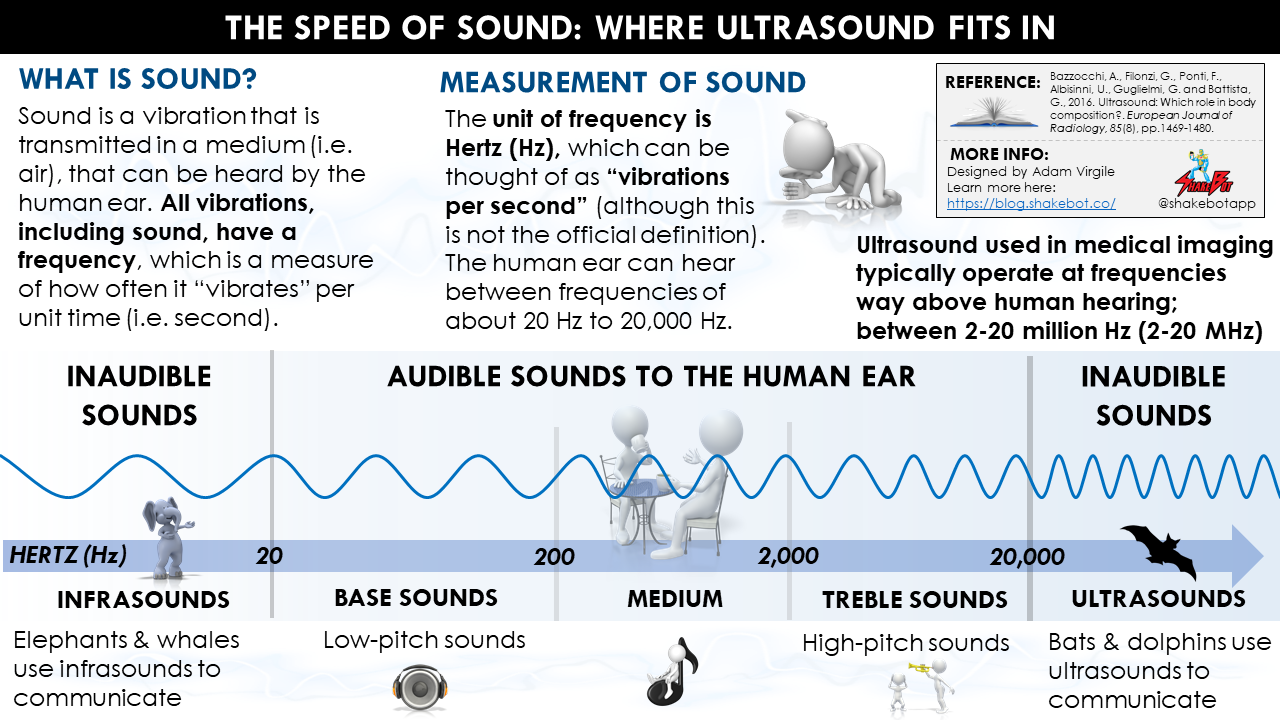
US = Ultrasound. Using a beam of skin-penetrating ultrasonic waves (i.e. high-frequency sound waves above the upper limit of human hearing) emitted by a transducer probe, body fat percentage is estimated based on the acoustic re?ection and impedance of different tissue borders. Similar to skinfold assessment, ultrasound is used to assess regional subcutaneous fat tissue. However, ultrasound measures the subcutaneous fat tissue thickness in a decompressed state (i.e. single layer), whereas skinfold assessment requires pinching of the skin and subsequent measurement of the same tissue in compressed state (i.e. double layer). Using a prediction equation, US estimates the breakdown of (1) lean mass, and (2) fat mass, inside the body.
Like skinfolds assessment, the US technique is known for its ability to measure subcutaneous adipose tissue (SAT). Researchers highlight a major limitation of skinfold thickness measurements: the SAT tissue is in a compressed state (i.e. double-layer of skin), without consideration of the compressibliity and viscous-elastic behavior at the individual measurement site [5-7]. The US technique does not have this limitation as it assesses the tissue thickness in a decompressed state, or as a single layer of SAT [8]. Recently, US has resurfaced, with research groups such as that of Muller et al. (2016) verifying that ultrasound (US) measurement technique enables subcutaneous adipose tissue (SAT) patterning with very high accuracy and precision [9]. Muller et al. (2016) also provide standardization protocols for valid and reliable data collection using US [9].
SAT = Subcutaneous adipose tissue. The fat that lies underneath the skin. Visceral adipose tissue (VAT) is highly concentrated inside the abdominal cavity, and/or surrounds the organs (stomach, liver, intestines, kidneys, etc.). Subcutaneous adipose tissue makes up ~80% of the total adipose tissue in the body, and visceral adipose tissue makes up the remaining ~20%. High levels of visceral adipose tissue has been linked to obesity-related diseases, whereas subcutaneous adipose tissue is typically not related to these pathologies.
How it Works
As you might guess, US uses how different tissues respond to sound to assess body composition [1]. A transducer probe (a probe that sends and receives sound waves) is covered with gel and is placed on the skin. Using a beam of sound waves, the transducer sends a sound signal through the body tissues (i.e. skin, subcutaneous fat, muscle, bone. etc.), and part of the sound signal gets reflected back (i.e. returned) to the transducer as an echo [1]. During assessment, you won’t hear the sounds transmitted by the ultrasound device because these sound waves are sent at super high frequencies (i.e. ultrasound) and are imperceptible to the human ear. Ultimately, an image depicting the tissues underneath the skin is produced; the way the image looks will depend on the “mode” of US used (A-Mode vs. B-Mode). I’ll talk about this in a little bit.
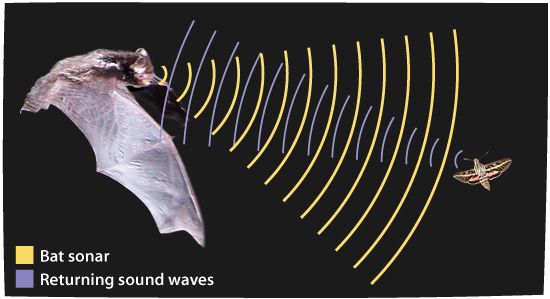
Image from Arizona State University: Ask a Biologist
Fun fact: Ever wondered how bats can “see” at night? Like the transducer, the bats send out ultrasound signals (imperceptible to the human ear). The direction and the time it takes for the signal to return to the bat allows it to identify the location of the object. The longer it takes for the signal to return, the further away the object.
For a step-by-step understanding, please see the description of how ultrasound machines work provided by Dr. Freudenrich, here [10]. I’ve posted these contents below:
- The ultrasound machine transmits high-frequency (1 to 5 MHz) sound pulses into your body using a probe.
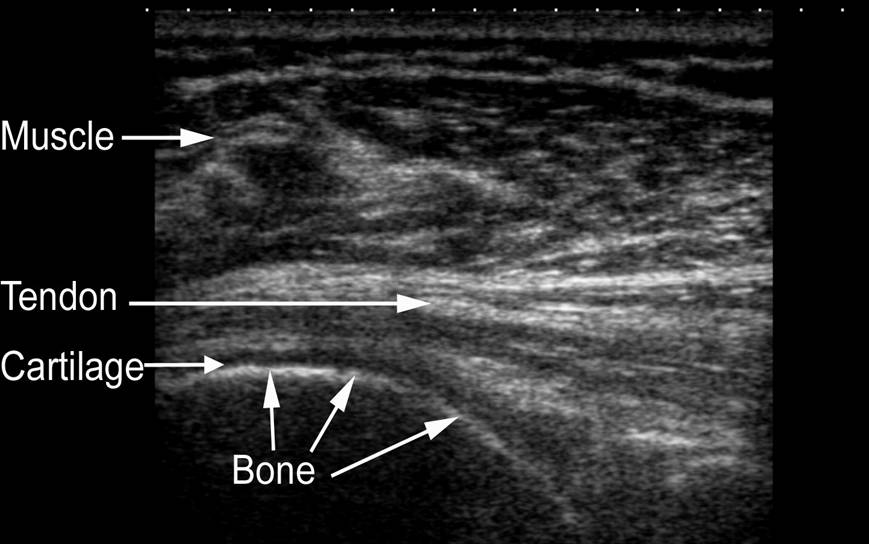
- The sound waves travel into your body and hit a boundary between tissues (e.g. between fluid and soft tissue, soft tissue and bone).
- Some of the sound waves get reflected back to the probe, while some travel on further until they reach another boundary and get reflected.
- The reflected waves are picked up by the probe and relayed to the machine.
- The machine calculates the distance from the probe to the tissue or organ (boundaries) using the speed of sound in tissue (5,005 ft/s or 1,540 m/s) and the time of the each echo’s return (usually on the order of millionths of a second).
- The machine displays the distances and intensities of the echoes on the screen, forming an image, such as the images below, from SonoZone (A-Mode; left) and London Sports Orthopaedics (B-Mode; right):
Every substance inside the body, such as a nerves, muscles, or fat, has a unique property called “acoustic impedance.” This “acoustic impedance” is determined by the density of the substance, which ultimately affects how much of the emitted sound wave passes through it, and how much is reflected back to the transducer [1]. While air has almost no impedance whatsoever, fat and muscle have impedances of 0.138?g·cm?1·s?1 and 0.170?g·cm?1·s?1, respectively, and bone has a relatively high impedance of 0.78?g·cm?1·s?1 [1]. The amount of the sound wave that is reflected back to the transducer depends on the difference of the acoustic impedance between the two substances; the greater the difference, the more of the sound is reflected back.
Bazzocchi et al. (2016). Ultrasound: Which role in body composition?. European Journal of Radiology, 85(8), pp.1469-1480.
As addressed previously, there are two different ways, or “modes” in which US is primarily used for body composition assessment: A-Mode (amplitude mode) and B-Mode (brightness mode). It’s important to understand the differences between these two modes when deciding if, and how, to use US for body composition assessment [11].
A-Mode vs. B-Mode
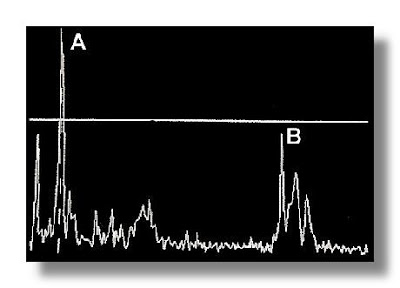
The simpler, but less often utilized mode is A-Mode (amplitude mode). The ultrasound wave that comes out of the transducer probe travels in a narrow, pencil-like, straight path. A-Mode results in an image that looks similar to a heart rate response, or electrocardiogram (image on left), and consists of a X and Y axis, where X represents the depth and Y represents the amplitude of the echo. Amplitude signal of the echo (Y Axis), is based on the strength of sound wave that is reflected back to the transducer probe (i.e. “echo”); the stronger the return signal, the higher the amplitude/peak of the amplitude spike. Tissue boundaries can be determined from the amplitude spikes [1].
Like A-Mode, B-Mode (i.e. brightness mode) also transmits a sound wave that travels in a narrow, pencil-like, straight path. This is a far more common method. Instead of a bump, or amplitude spike, the strength of the returning sound wave is recorded by a bright dot [1]. The brightness of the dot represents the strength of the returning sound wave; the brighter the dot, the stronger the returning wave. Ultimately, a two-dimensional gray-scale image depicting the underlying tissues is created (image on right).
While A-Mode sound waves are sent discontinuously, B-Mode sends a linear array of sound waves to produce a two-dimensional image by combining A-mode signals from various directions [1]. Strong reflections appear as white dots; weaker reflections appear grey, and no echoes are black. This produces a two-dimensional grey-scale image of the tissues inside the body, like the one below [1]. With both A- and B-modes, the transducer probe is moved across the surface of the body by a trained technician, and signals are recorded at the anatomical site(s) where body composition assessment is warranted.
A-Mode (amplitude mode) is generally portable, simple to execute, and easy to comprehend, but is not often used in clinical research. B-Mode (brightness mode) works in a similar fashion, but most devices are not portable, and it produces an entirely different image (see above) which may require a higher degree of expertise to interpret.
Accuracy and Reliability
Much of the previous ultrasound (US) research has used B-Mode (brightness-mode) technology [7, 9, 12-17], but the significant economic costs and the need for software that depends on interpretation by highly-trained professionals make it practically difficult to use B-Mode technology in many athletic contexts [6]. Although initially recognized for animal use, such as the estimation of fat mass in pigs [18] or the pregnancy status in fishes [19], A-Mode portable ultrasounds have recently been investigated as a low-cost alternative to measuring skinfold thickness for regional body composition assessment, in humans [8, 20, 21].
The use of a portable ultrasound (US) device is a valid and reliable tool for measuring body fat percentage in the general population [22-27], adolescents [28], and in athletes [14, 16, 20, 29-31]. Estimated body fat percentages with US are strongly correlated with those obtained by dual-energy x-ray absorptiometry (DXA) and/or skinfold assessments for male and female athletes with various shapes and sizes [14-16, 20, 29-31]. However, it’s imperative to understand that, although skinfold measurement and US are similar in many regards, the measurements are not interchangeable [21]. As observed by Buxade et al. (2018), skinfold thickness measurements will be higher when assessed via skinfold pinching technique compared with US, likely due to necessary compression of the skinfolds (i.e. double layer of skin) during US assessment [21]. US also has an ideal standard estimate of error (SEE) in athletes; between 1-3% [16, 29, 30].
DXA = Dual energy x-ray absorptiometry. Passes filtered x-ray beams with two different photon energies (emitting a very small dose of ionizing radiation) through the body to produce pictures of the inside of the body, and is considered one of the “gold standard” methods for body composition assessment. DXA can estimate the breakdown of (1) lean mass, (2) fat mass, and (3) bone mineral content, by body segment, because each tissue differentiates photons differently.
In general, US methods have high accuracy and reliability for populations of all sizes, including athletes, when the procedure is standardized [9, 32]. Furthermore, research by Wagner et al. (2016), Muller et al. (2016), and Kopinski et al. (2015) demonstrate high reliability of US measurements, even when different protocols and untrained investigators are used [9, 15, 20]. Recently, Muller et al. (2016) published a comprehensive set of standardization guidelines for US measurements, which will undoubtedly further enhance the validity and reliability of this method for body composition assessment [9].
US should be considered a pragmatic body composition assessment method in sport, particularly because accurate and reliable US systems as small as notebooks are available today. Although more expensive equipment and higher levels of technological training are required compared with anthropometric techniques, when all things are considered, US may be the ideal option for evaluating subcutaneous adipose tissue (SAT) in sport environments [9]. It’s also important to appreciate its novelty; standardization of techniques, equipment advancements, and norms in athletes are still emerging, which makes it difficult to adopt US as a standalone method for body composition assessment in sport, today.
Common Sources of Error
Obtaining accurate and reliable results mostly boils down to the knowledge and expertise of the technician or practitioner. As aforementioned, the recent set of guidelines provided by Muller et al. (2016) really clears the mud out of the water. Understanding the precise location of the suggested sites and how to properly align the US transducer probe (i.e. parallel with the alignment of the underlying muscle fibers) are keys for obtaining accurate results.
If the technician or practitioner has experience with ultrasound devices, and participates in a structured training program that includes (1) site-marking experience, (2) handling the US system, (3) application of the image segmentation and SAT measurement program, and (4) guided exercises and interobserver comparisons, then potential error will be minimized.
A Brief Note on Muscle Glycogen and Hydration
There is potential for ultrasound to assess hydration status [33] and muscle glycogen content [34, 35]. However, there is very little research in this area in humans, and so far, the use of ultrasound for these purposes is not validated, nor advised [36, 37]. With that being said, if it is determined that ultrasound can quantify muscle glycogen content and/or hydration status with high levels of accuracy and reliability, it becomes an incredibly dynamic tool for body composition assessment in athletes and sport.
Pros and Cons
Larson-Meyer et al. (2018) and Wagner (2013) provide nice lists of pros and cons, which I’ve combined and altered, and placed below [1, 38]:
| Advantages | Disadvantages |
| Portable | Technique and equipment may still be considered preliminary |
| Allows for regional body composition assessment | Databases and norms in athletes are lacking, and in development |
| Highly accurate and reliable when used by trained technician | More expensive than skinfold calipers |
| Subcutaneous tissue is uncompressed (it is compressed with skinfold techniques) | Requires trained technician |
| Noninvasive and no ionizing radiation | Inherent artifacts (fascia, etc.) |
| Potential to assess muscle glycogen and/or hydration |
Summary
Although ultrasound (US) has been used to accurately assess body composition since the mid-1960s, its use among sport professionals for body composition assessment has remained dormant, for the most part. The use of other techniques, such as skinfolds assessment, bioelectrical impedance analysis, air displacement plethsymography (i.e. BOD POD), and dual energy x-ray absorptiometry, have been far more prevalent in athletes.
There are two types of US typically used for body composition assessment; A-mode (amplitude mode) and B-mode (brightness mode). A-mode is easier to interpret, but is also less often used in the research, compared with B-mode. Each mode works slightly differently, and it’s important to understand these differences prior to making a decision about the body composition assessment tool you will be using with athletes.
Despite its portability and high degrees of validity and reliability, a trained technician or practitioner is required for obtaining accurate measurements. Although skinfolds assessment and US are both capable of assessing regional body composition, US is advantageous because it measures the skinfold thicknesses in an uncompressed state, whereas the pinching of the skinfolds with skinfolds assessment creates a double layer (compressed tissue), which can reduce the accuracy of measurements.
The re-emergence of US as an ideal option for measuring body composition in athletes is happening quickly. Recent standardization protocols published by Muller et al. (2016) further enhance the very high accuracy and precision of US for assessing and monitoring body composition in athletes. As is the case with any body composition assessment method, understanding the factors that affect the accuracy and reliability of US, and applying a standardized approach for data collection is advised to avoid measurement artifact caused by these factors [33]. Because of its practical applicability in the sport setting and high level of accuracy and reliability in various populations, including athletes, US warrants serious consideration as the mode of choice of body composition assessment for sport organizations that can afford it.
Inherent limitations exist with all body composition assessment techniques, including methodological assumptions and measurement errors. Above all, selecting a body composition method that meets the expectations and is context-appropriate for the sport organization, and appreciating that different body composition techniques and protocols are not interchangeable, is perhaps the most important aspect of body composition assessment for sport professionals to understand.
Enjoying the Content?
Instantly become an important part of the Shakebot community by connecting with me on social media:


Reference
- Wagner, D.R., 2013. Ultrasound as a tool to assess body fat. Journal of Obesity, 2013.
- Booth, R.D., Goddard, B.A. and Paton, A., 1966. Measurement of fat thickness in man: a comparison of ultrasound, Harpenden calipers and electrical conductivity. British Journal of Nutrition, 20(4), pp.719-725.
- Bullen, B.A., Quaade, F., Olesen, E. and Lund, S.A., 1965. Ultrasonic reflections used for measuring subcutaneous fat in humans. Human Biology, pp.375-384.
- Meyer, N.L., Sundgot-Borgen, J., Lohman, T.G., Ackland, T.R., Stewart, A.D., Maughan, R.J., Smith, S. and Müller, W., 2013. Body composition for health and performance: a survey of body composition assessment practice carried out by the Ad Hoc Research Working Group on Body Composition, Health and Performance under the auspices of the IOC Medical Commission. British Journal of Sports Medicine, pp.bjsports-2013.
- Ackland, T.R., Lohman, T.G., Sundgot-Borgen, J., Maughan, R.J., Meyer, N.L., Stewart, A.D. and Müller, W., 2012. Current status of body composition assessment in sport. Sports Medicine, 42(3), pp.227-249.
- Müller, W. and Maughan, R.J., 2013. The need for a novel approach to measure body composition: is ultrasound an answer?. British Journal of Sports Medicine, 47(16), p.1001.
- Müller, W., Horn, M., Fürhapter-Rieger, A., Kainz, P., Kröpfl, J.M., Maughan, R.J. and Ahammer, H., 2013. Body composition in sport: a comparison of a novel ultrasound imaging technique to measure subcutaneous fat tissue compared with skinfold measurement. British Journal of Sports Medicine, 47(16), pp.1028-1035.
- Schoenfeld, B.J., Aragon, A.A., Moon, J., Krieger, J.W. and Tiryaki?Sonmez, G., 2017. Comparison of amplitude?mode ultrasound versus air displacement plethysmography for assessing body composition changes following participation in a structured weight?loss programme in women. Clinical Physiology and Functional Imaging, 37(6), pp.663-668.
- Müller, W., Lohman, T.G., Stewart, A.D., Maughan, R.J., Meyer, N.L., Sardinha, L.B., Kirihennedige, N., Reguant-Closa, A., Risoul-Salas, V., Sundgot-Borgen, J. and Ahammer, H., 2016. Subcutaneous fat patterning in athletes: selection of appropriate sites and standardisation of a novel ultrasound measurement technique: ad hoc working group on body composition, health and performance, under the auspices of the IOC Medical Commission. British Journal of Sports Medicine, 50(1), pp.45-54.
- Freudenrich, C., 2001. How ultrasound works. How Stuff Works, 22.
- Fosbøl, M.Ø. and Zerahn, B., 2015. Contemporary methods of body composition measurement. Clinical Physiology and Functional Imaging, 35(2), pp.81-97.
- Semiz, S. and Sabir, N., 2007. Comparison of ultrasonographic and anthropometric methods to assess body fat in childhood obesity. International Journal of Obesity, 31(1), p.53.
- Akyer, ?.P., Ad?güzel, E., Sabir, N., Akdo?an, I., Y?lmaz, B. and Yonguç, G.N., 2014. Comparison of ultrasonography and skinfold measurements of subcutaneous fat thickness in the evaluation of body composition. Anatomy, 8(1).
- Hyde, P.N., Fairman, C., Coker, N., Yarbrough, M.B., Rossi, S. and Kendall, K., 2015. Utilization Of B-mode Ultrasound As A Body Fat Estimate In Collegiate Football Players. Medicine & Science in Sports & Exercise, 47(5S), p.35.
- Kopinski, S., Engel, T., Cassel, M., Fröhlich, K., Mayer, F. and Carlsohn, A., 2015. Ultrasound applied to subcutaneous fat tissue measurements in international elite canoeists. International Journal of Sports Medicine, 36(14), pp.1134-1141.
- O’Neill, D.C., Cronin, O., O’Neill, S.B., Woods, T., Keohane, D.M., Molloy, M.G. and Falvey, E.C., 2016. Application of a Sub-set of Skinfold Sites for Ultrasound Measurement of Subcutaneous Adiposity and Percentage Body Fat Estimation in Athletes. International Journal of Sports Medicine, 37(05), pp.359-363.
- Selkow, N.M., Pietrosimone, B.G. and Saliba, S.A., 2011. Subcutaneous thigh fat assessment: a comparison of skinfold calipers and ultrasound imaging. Journal of Athletic Training, 46(1), pp.50-54.
- McEvoy, F.J., Strathe, A.B., Madsen, M.T. and Svalastoga, E., 2007. Changes in the relative thickness of individual subcutaneous adipose tissue layers in growing pigs. Acta Veterinaria Scandinavica, 49(1), p.32.
- Novelo, N.D. and Tiersch, T.R., 2012. A review of the use of ultrasonography in fish reproduction. North American Journal of Aquaculture, 74(2), pp.169-181.
- Wagner, D.R., Cain, D.L. and Clark, N.W., 2016. Validity and reliability of A-mode ultrasound for body composition assessment of NCAA division I athletes. PloS one, 11(4), p.e0153146.
- Buxadé, C.P.C., Solà-Perez, T., Castizo-Olier, J., Carrasco-Marginet, M., Roy, A., Marfell-Jones, M. and Irurtia, A., 2018. Assessing subcutaneous adipose tissue by simple and portable field instruments: Skinfolds versus A-mode ultrasound measurements. PloS one, 13(11), p.e0205226.
- Pineau, J.C., Guihard-Costa, A.M. and Bocquet, M., 2007. Validation of ultrasound techniques applied to body fat measurement. Annals of Nutrition and Metabolism, 51(5), pp.421-427.
- Toomey, C., McCreesh, K., Leahy, S. and Jakeman, P., 2011. Technical considerations for accurate measurement of subcutaneous adipose tissue thickness using B-mode ultrasound. Ultrasound, 19(2), pp.91-96.
- Johnson, K.E., Naccarato, I.A., Corder, M.A. and Repovich, W.E., 2012. Validation of three body composition techniques with a comparison of ultrasound abdominal fat depths against an octopolar bioelectrical impedance device. International Journal of Exercise Science, 5(3), p.205.
- Smith-Ryan, A.E., Fultz, S.N., Melvin, M.N., Wingfield, H.L. and Woessner, M.N., 2014. Reproducibility and validity of A-mode ultrasound for body composition measurement and classification in overweight and obese men and women. PloS one, 9(3), p.e91750.
- Bielemann, R.M., Gonzalez, M.C., Barbosa-Silva, T.G., Orlandi, S.P., Xavier, M.O., Bergmann, R.B. and Assunção, M.C.F., 2016. Estimation of body fat in adults using a portable A-mode ultrasound. Nutrition, 32(4), pp.441-446.
- Smith?Ryan, A.E., Blue, M.N., Trexler, E.T. and Hirsch, K.R., 2018. Utility of ultrasound for body fat assessment: validity and reliability compared to a multicompartment criterion. Clinical Physiology and Functional Imaging, 38(2), pp.220-226.
- Ripka, W.L., Ulbricht, L., Menghin, L. and Gewehr, P.M., 2016. Portable A?Mode Ultrasound for Body Composition Assessment in Adolescents. Journal of Ultrasound in Medicine, 35(4), pp.755-760.
- Pineau, J.C., Filliard, J.R. and Bocquet, M., 2009. Ultrasound techniques applied to body fat measurement in male and female athletes. Journal of Athletic Training, 44(2), pp.142-147.
- Bellisari, A. and Roche, A.F., 2005. Anthropometry and ultrasound. Human Body Composition, 2, pp.109-28.
- Kelso, A., Trájer, E., Machus, K., Treff, G., Müller, W. and Steinacker, J.M., 2017. Assessment of subcutaneous adipose tissue using ultrasound in highly trained junior rowers. European Journal of Sport Science, 17(5), pp.576-585.
- Störchle, P., Müller, W., Sengeis, M., Ahammer, H., Fürhapter-Rieger, A., Bachl, N., Lackner, S., Mörkl, S. and Holasek, S., 2017. Standardized ultrasound measurement of subcutaneous fat patterning: high reliability and accuracy in groups ranging from lean to obese. Ultrasound in Medicine & Biology, 43(2), pp.427-438.
- Sarvazyan, A., Tatarinov, A. and Sarvazyan, N., 2005. Ultrasonic assessment of tissue hydration status. Ultrasonics, 43(8), pp.661-671.
- Sanders, G., Boos, B., Shipley, F. and Peacock, C., 2018. Bilateral Asymmetries in Ultrasound Assessments of the Rectus Femoris throughout an NCAA Division I Volleyball Preseason. Sports, 6(3), p.94.
- Nieman, D.C., Shanely, R.A., Zwetsloot, K.A., Meaney, M.P. and Farris, G.E., 2015. Ultrasonic assessment of exercise-induced change in skeletal muscle glycogen content. BMC Sports Science, Medicine and Rehabilitation, 7(1), p.9.
- Bone, J.L., Ross, M.L., Tomcik, K.A., Jeacocke, N.A., Hawley, J.A. and Burke, L.M., 2016. Ultrasound Technology Fails To Provide Indirect Estimate Of Muscle Glycogen Concentration: 1891 Board# 43 June 2, 2. Medicine & Science in Sports & Exercise, 48(5S), p.520.
- Greene, J., Louis, J., Korostynska, O. and Mason, A., 2017. State-of-the-art methods for skeletal muscle glycogen analysis in athletes—the need for novel non-invasive techniques. Biosensors, 7(1), p.11.
- Kerr, A.D., Slater, G.J. and Byrne, N.M., 2018. Influence of subject presentation on interpretation of body composition change after 6 months of self-selected training and diet in athletic males. European Journal of Applied Physiology, 118(6), pp.1273-1286.