What does a game look like for the typical NHL positional player? It’s pretty easy to figure out… just do some simple math on the stats from the NHL website. The typical position player will have 20-35 shifts/game, each lasting 60-90 seconds in duration. This appears simple, on the surface, but let’s take a deeper look.
- An Overview of NHL In-Game Requirements
- A Much Deeper Assessment
- The Relationship Between Off-Ice and On-Ice
- 1. Correlations Between Off-Ice and On-Ice Physiological Capabilities
- Research in Elite Players
- Summary of Research in Elite Players
- Research in Sub-Elite Players
- Summary of Research in Sub-Elite Players
- Complete Summary of Off-Ice and On-Ice Performance Correlates
- 2. Correlations Between Off-Ice Performance and On-Ice Success
- Research in NHL Players and the NHLED Combine
- Research From the NHLED Combine
- Research in NHL Players from a NHL Training Camp
- Research in Elite Leagues from Overseas
- Research in NCAA Players
- Complete Summary of Off-Ice Performance and On-Ice Success Correlates
- Practical Applications
- Reference
An Overview of NHL In-Game Requirements
Before we evaluate potential relationships between off-ice and on-ice performance, it’s important to understand the on-ice requirements of elite hockey players.
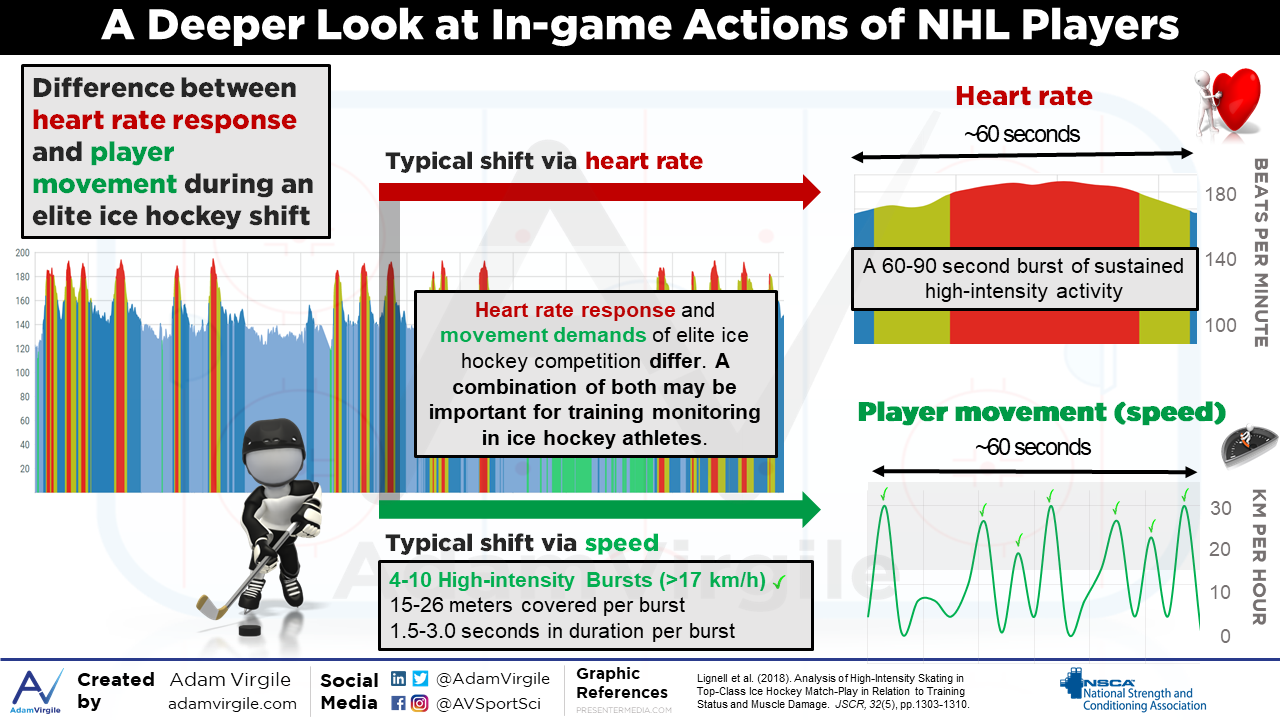
Although no published in-game NHL kinematic data existed at the time, a group of researchers examined data from the NHL database and found that, on average, a NHL forward had 6.8 +/- 1.1 shifts per period, each lasting 45.5 +/- 3.9 seconds, with a rest interval of 73.4 +/- 16.6 seconds [1]. Using data gathered by Montgomery et al. (2000) estimating that players spend roughly 50% of their shift time in high-intensity activity [38], it was determined that a forward will likely spend ~22.7 seconds of a shift in maximal or near-maximal skating. This estimate was recently proven to be quite accurate when objective accelerometry data was collected during an official NHL game [2].
A Much Deeper Assessment
In an analysis of 35 NHL players (24 Forwards, 11 Defensemen) participating in an official NHL game (including an overtime period), distances covered at slow, moderate, and high speeds were 41.6%, 14.1%, and 44.3%, respectively, of total distance covered [2]. During the game, players performed a total of 19 all-out sprints covering 26 meters, on average. They performed an additional 94 high-intensity bouts during the game, with average lengths between 15-16 meters. In total, this equates to 113 high-intensity bouts over distances between 15-26 meters during the course of a game (~7 bouts per minute on-ice), [2].
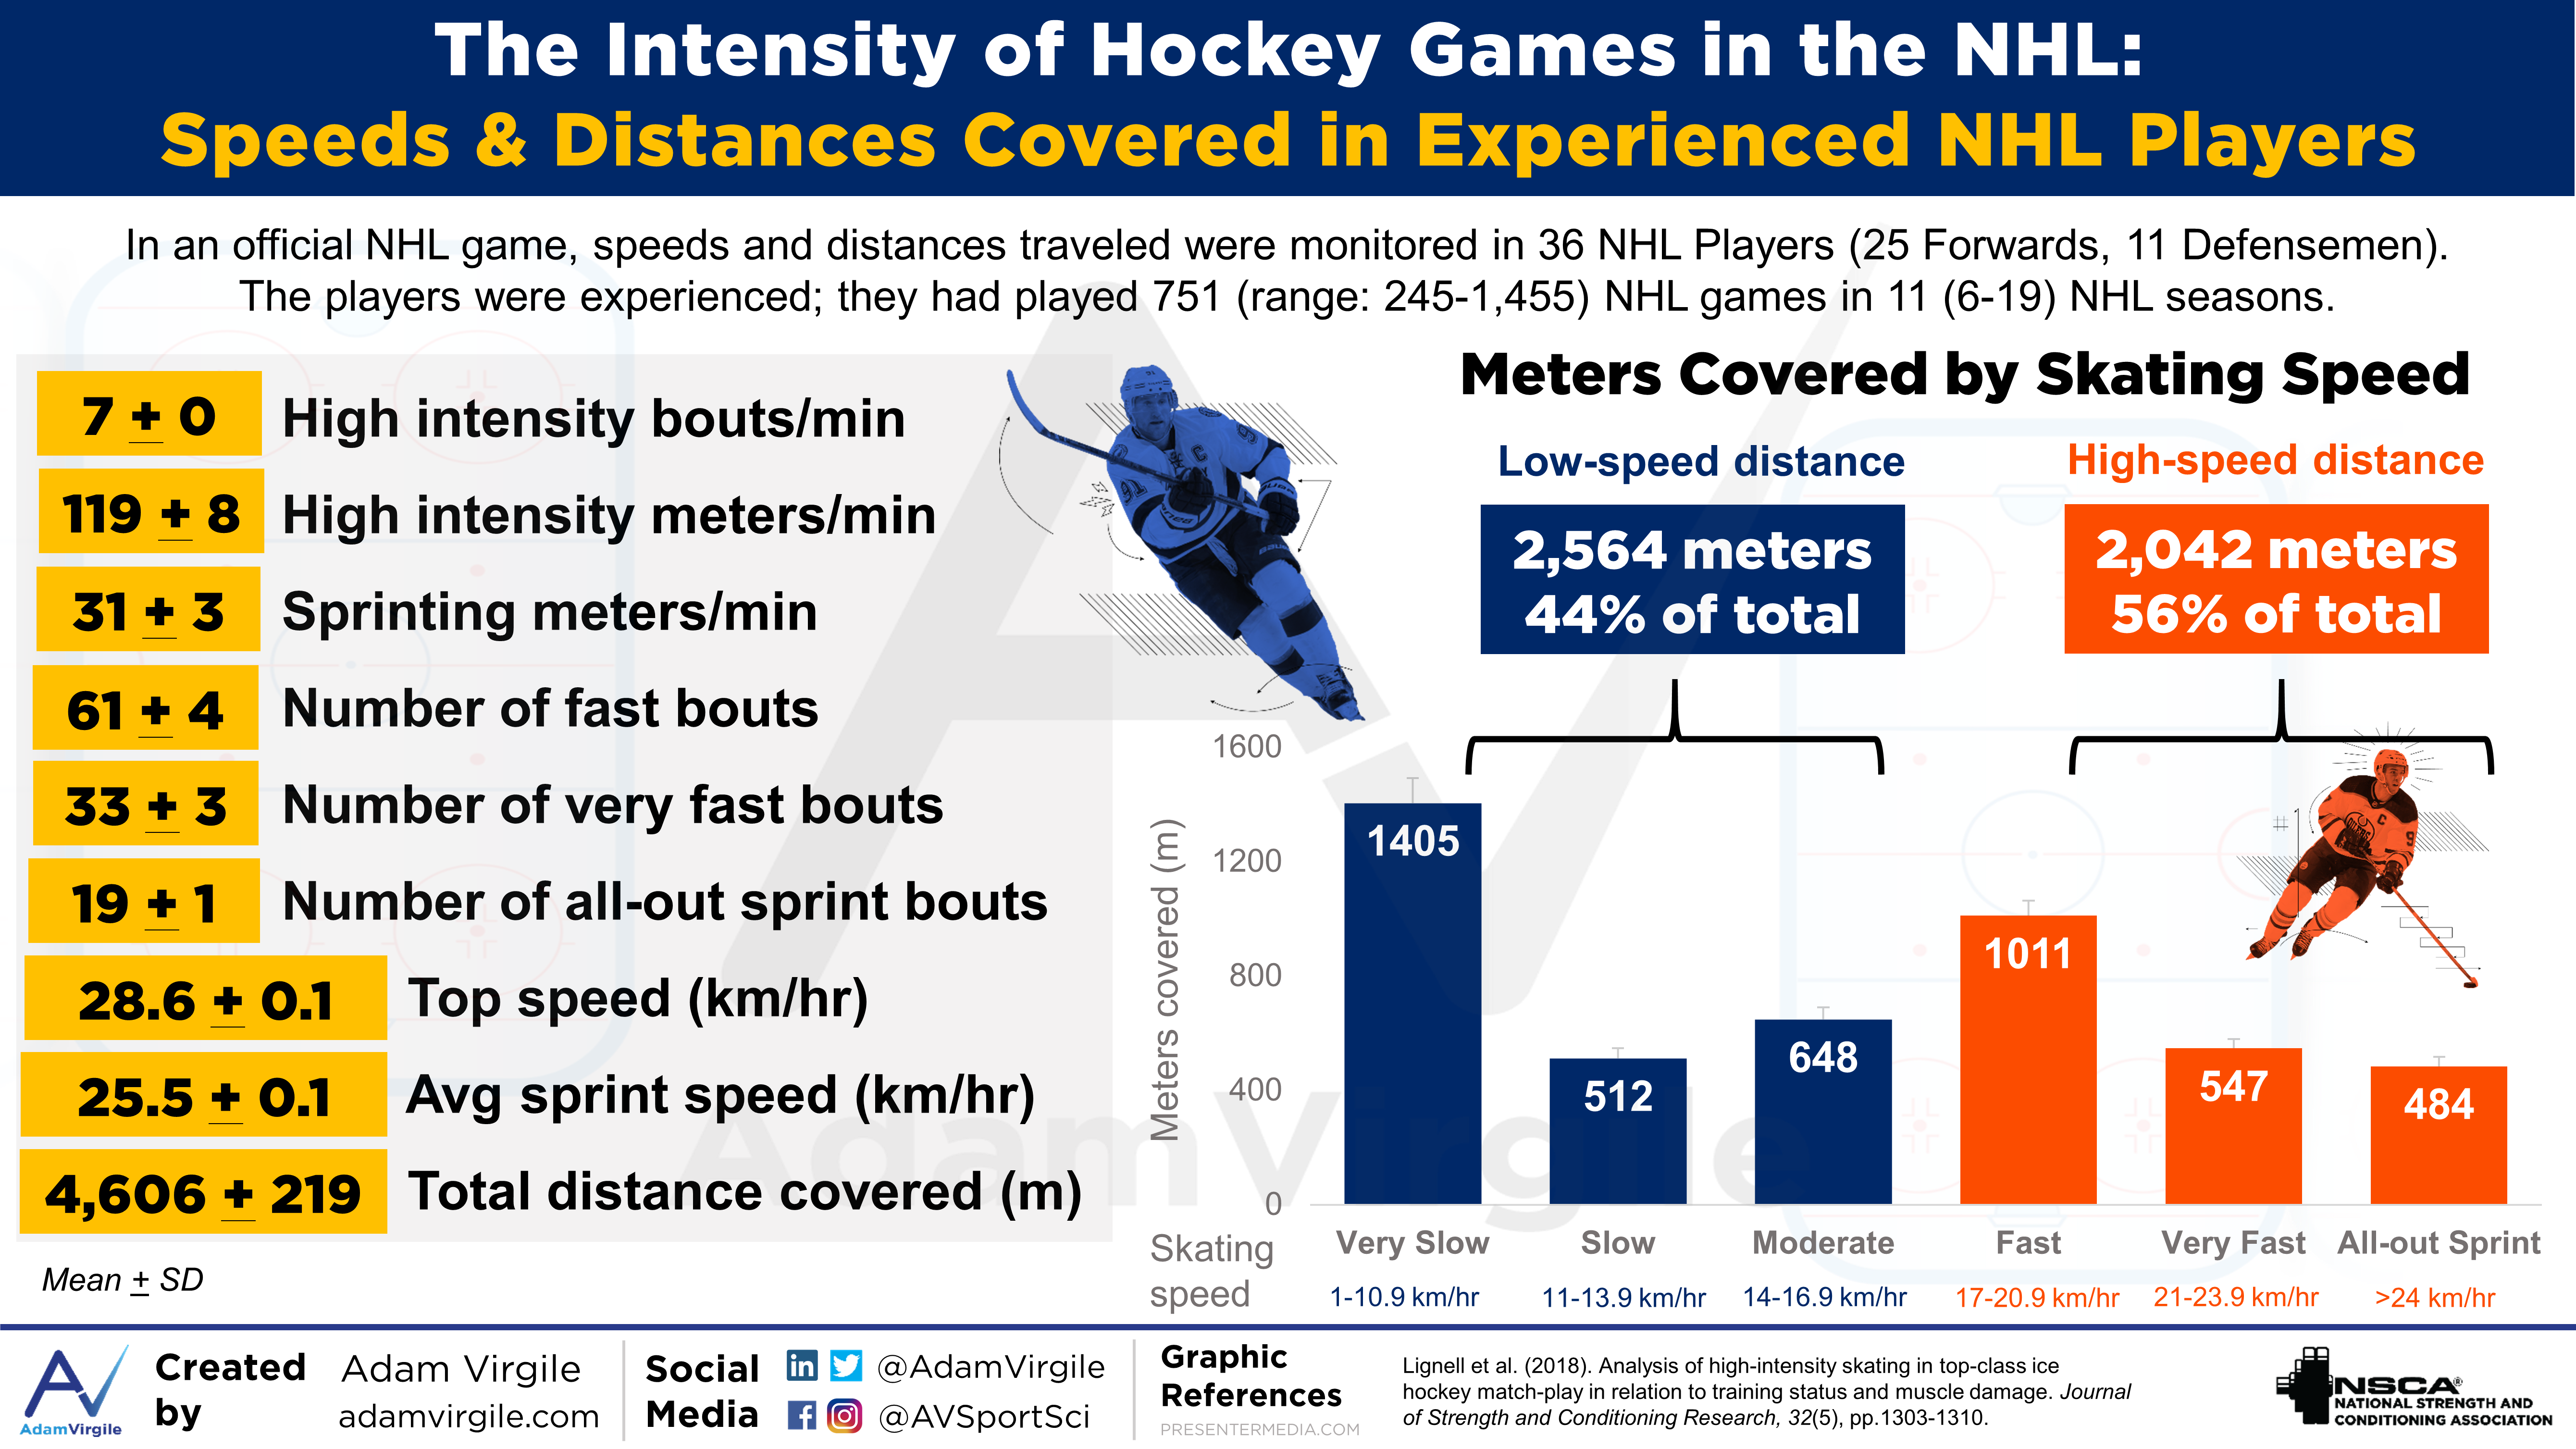
This research expands upon the notion that NHL players performed 20-35 high-intensity shifts, each lasting 60-90 seconds in duration: we now know that, within each shift (i.e. per minute on-ice), the average player performs 4-10 high-intensity bouts over distances between 15-26 meters long [2].
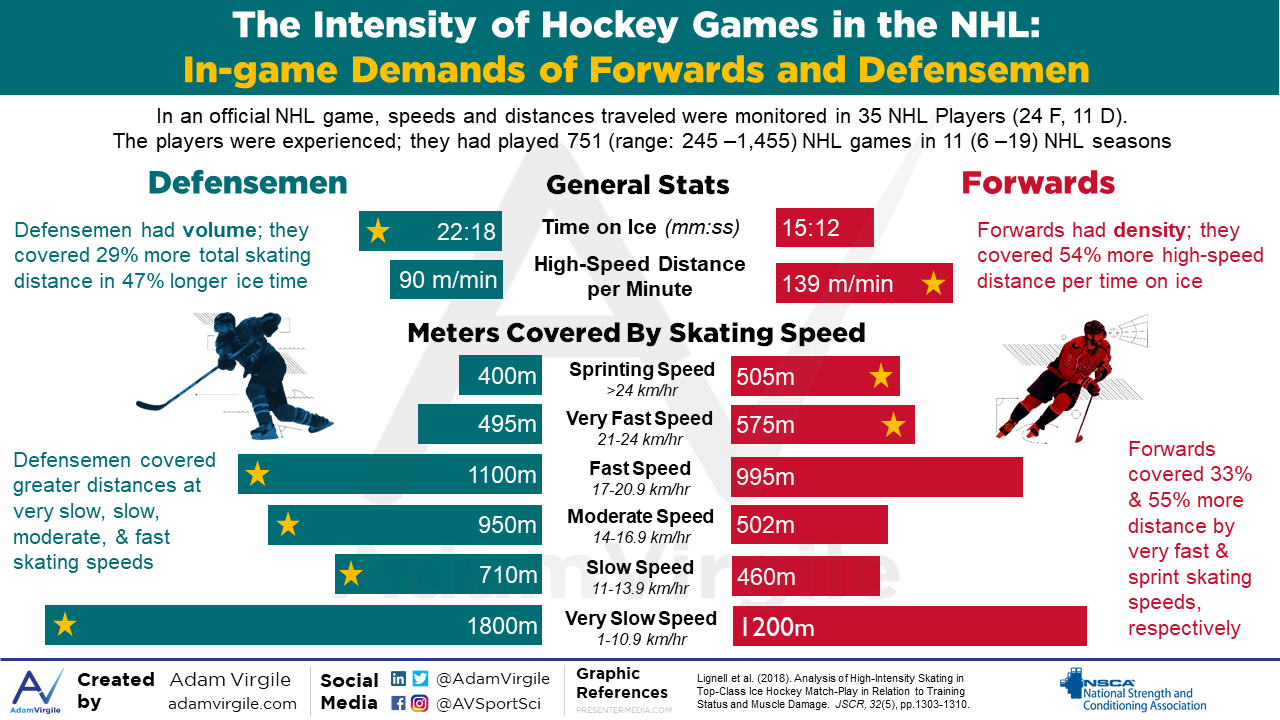
Forwards and Defensemen have different in-game duties, which results in significant differences in physiological outputs [2]. Defensemen covered 29% more skating distance and spent 47% longer time on-ice, compared with Forwards [2]. Since Defensemen spend more time on the ice, although there was no difference in high-intensity skating between the two positions, Forwards covered 54% more distance by high-intensity skating per unit of time (55% and 33% greater distances by sprint and very fast skating, respectively). By contrast, Defensemen covered greater distances by fast, moderate, slow, and very slow skating, relative to Forwards [2].
Together, this body of research highlights both the importance of training high-intensity and high-velocity efforts, as well as having a well-developed tolerance for repeated anaerobic exertions.
The Relationship Between Off-Ice and On-Ice
There are a multitude of factors that influence successful ice hockey performance, including both on-ice and off-ice characteristics. The purpose of this review is to identify which, if any, off-ice performance qualities have an impact on on-ice success.
Before moving on, please take a moment to understand how I’m breaking up this review. It’s broken into two parts:
- Correlations between off-ice and on-ice physiological performance
- A study investigating the relationship between vertical jump height and on-ice 30-meter sprint time (i.e. skating speed) would fall into this category
- Correlations between off-ice performance and on-ice success
- A study investigating the relationship between vertical jump height and future games played in the NHL (i.e. success) would fall into this category
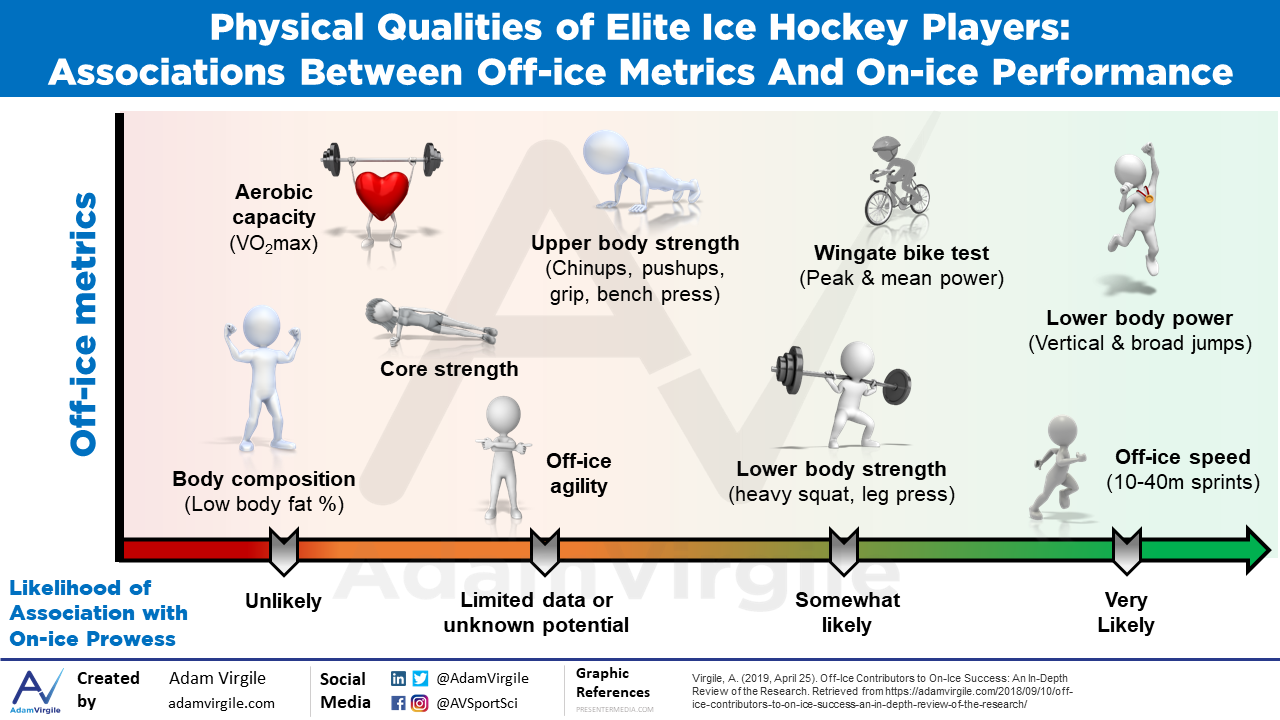
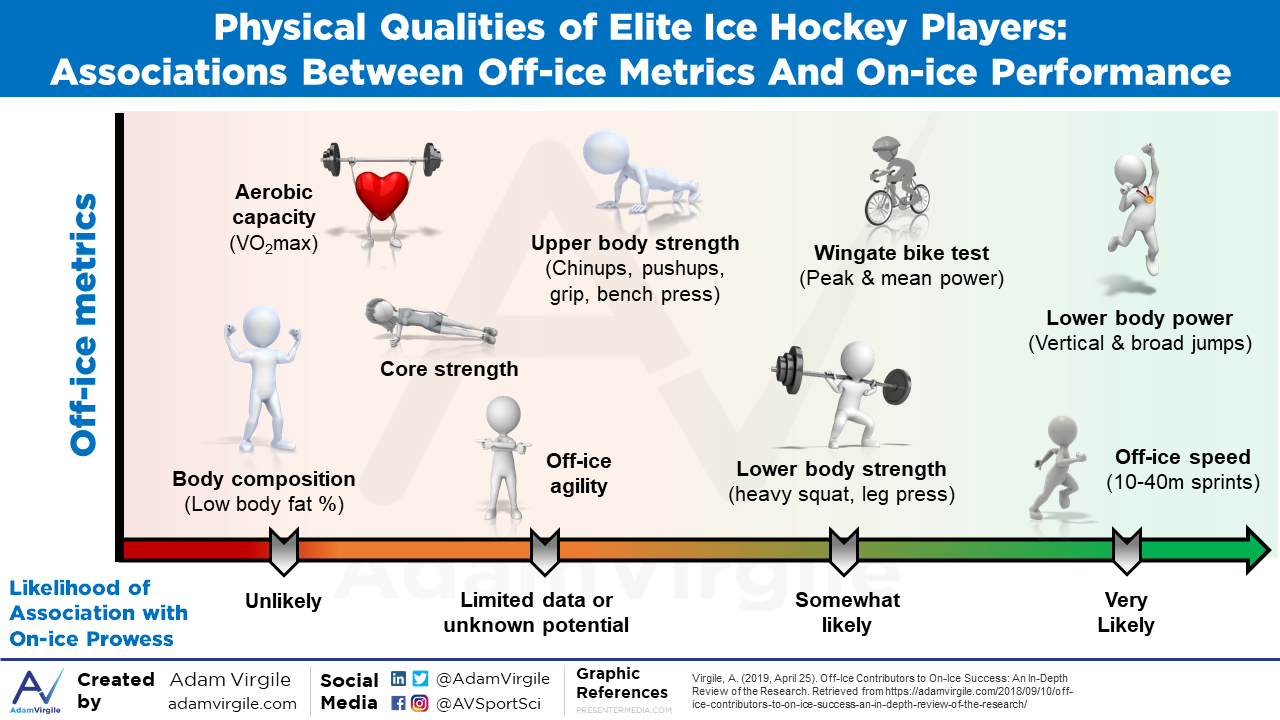
Throughout the article, I’ll be highlighting the off-ice metrics that correlated with on-ice performance/success in green, those with very limited data, unknown, or moderate correlations in orange, and those that did not correlate, in red.
1. Correlations Between Off-Ice and On-Ice Physiological Capabilities
Although a paucity of research exists, investigations between off-ice physical traits and on-ice speed have been investigated for decades. Back in 1992, vertical jump height was found to be the best predictor of on-ice skating speed (time required to sprint 54.9 meters) in 8 NHL players [3]. Broad jump, 40-yard sprint (off-ice), and isokinetic power were also assessed, but were not significant predictors of skating speed [3]. Lately, research hasn’t focused on NHL athletes, aside from one recent study [2]. Recent research has investigated ice hockey players competing at slightly lower levels, including NCAA Division I and elite junior-level [1, 4-9], as well as various other degrees of lower-level competition [10-16]. I’ll go into detail in the studies performed on NCAA Division I and other elite ice hockey players due to the closeness of the relationship of caliber between these players and NHL players.
Research in Elite Players
In 2018, 18 NHL players performed a 6-minute, submaximal on-ice Yo-Yo test (i.e. “bleep test”) and a graded aerobic capacity test on a cycle ergometer [2]. Cardiovascular loading during the submaximal Yo-Yo skating test correlated with subsequent in-game total high-intensity, very fast speed skating distance, and a higher number of high-intensity skating bouts [2]. VO2max via the cycle ergometer protocol correlated with total high-intensity skating distance [2].
In 2016, off-ice metrics were associated with on-ice acceleration and speed in 45 male hockey players, ages 18-24 and playing Division I, Division III, or Junior level hockey [1, 4]. Aerobic capacity (VO2max) was not associated with repeated sprint performance during a repeated-sprint skate test (i.e. “Peterson” test), [1]. The Peterson test consists of 8 non-linear maximal skating bouts lasting ~20-25 seconds each, with 90 seconds of passive recovery between bouts. Vertical jump height, wingate relative peak power, and wingate relative mean power were each significantly correlated with on-ice acceleration, velocity, and fastest course time, but not repeated sprint performance, during the Peterson test [4]. These results suggest that players with higher power outputs may possess an advantage over other skaters during a single bout via their ability to accelerate more quickly and reach higher top end speeds on the ice. The authors of the study contend that these elevated power outputs, “while apparently advantageous during single bouts, do not contribute to a player’s ability to repeatedly perform shifts on the ice,” [4]. While a remarkable study, I have a minor issue with its conclusion; it over-generalizes the results of the study, and the statement made is, likely, false. I need to pause this research review for a moment to tell you why I believe this conclusion could be inaccurate, and potentially misleading:
In the first section of this article, we learned that a shift for a NHL forward is ~45 seconds in length (on average), and the typical player produces 4-10 high-intensity bouts per shift. In a game, NHL players are not producing what the Peterson test entails; a 20-25 second sustained maximal-intensity burst per shift.
From my observations of NHL players, an on-ice 30-meter sprint takes 3-4 seconds to complete; faster athletes take 3.0-3.3 seconds, and slower athletes take 3.5-4.0 seconds (you’ll see data supporting this observation in a later section). Therefore, during each shift, an NHL player is likely performing between 4-10 high-intensity bouts, each being a 1.5-3.0 second burst of high-intensity skating, as opposed to one 20-25 second sustained maximal-intensity burst per shift.
The energy system demands and replenishment opportunities differ tremendously between these two scenarios. Performing an all-out 20-25 second burst of high-intensity skating nearly ensures complete ATP-PCr energy system utilization (and subsequent depletion) with no intra-shift repletion opportunity. Performing interspersed 1.5-3.0 second bursts of high-intensity activity, in addition to the typical 2.3 play stoppages (resulting in ~27 seconds of stoppage time) per shift, allows a far greater opportunity for intra-shift and inter-shift repletion of PCr. This provides a player with higher peak power generation capabilities a greater opportunity to repeatedly utilize this advantage, within and between shifts.
Runner et al. (2016) investigated how vertical jump, broad jump, 40-yard dash, and heavy back squat performances related on-ice forward acceleration, backward acceleration, and 50-foot flying top speed, in 40 male, NCAA Division 1 ice hockey players [9]. Vertical jump performance was strongly correlated with all three on-ice skating tests [9]. Although 40-yard dash, broad jump, and back squat performances were also correlated with on-ice performance, when the variables were put into multiple regression equations, only vertical jump remained as a significant predictor [9]. In 11 male U18 and U20 Division I hockey players competing in Sweden, 1-repetition maximum back squat (both absolute and relative to body weight), broad jump, and relative wingate mean power, but not relative wingate peak power, correlated with on-ice 17.5-meter sprint speed [8].
In 2017, a group of 18, male, under-18-years-old (U18) and under-20-years-old (U20) ice hockey players competing in the highest national division for their age in Norway performed 8-week strength and conditioning programs [7]. Some players trained strength only (ST only) whereas other players trained using combined strength and plyometrics (ST+PLY). The group incorporating plyometrics into their training (ST+PLY) experienced greater improvements in broad jump and 10-meter skating performance, compared with the strength only group (ST only). Both groups improved 3-hop broad jump, 1RM squat, on-ice aerobic fitness (skating multistage aerobic test), and repeated cycle sprint performances to similar extents. These results suggest that increases in lower body power (i.e. broad jump) may have a greater positive impact on-ice skating speed and could affect on-ice skating speed, compared with other physical attributes [7].
Haukali et al. (2015) conducted a study was done in 15 male junior hockey players from the Norwegian junior (under 18) elite series [17]. This is the highest-level national series for this age group. Off-ice 36-meter sprint and vertical jumping (countermovement jump; squat jump) performances were associated with on-ice 36-meter sprint performance [17]. Vertical jump performance was also associated with on-ice agility, whereas off-ice sprinting ability was not.
Summary of Research in Elite Players
In elite hockey players, off-ice lower body power performance metrics appear to be associated with on-ice performance, more often than not [3, 4, 7-9, 17]. When measured, vertical jump [3, 4, 9, 17], and broad jump [7-9] correlated with on-ice performance. Additionally, coinciding increases in lower body power and on-ice sprint speed were observed after 8 weeks of off-ice resistance training, but only when lower body power exercises [7]. Lower body strength may also affect on-ice capabilities; there’s evidence of heavy back squat [8] and wingate power [4, 8] correlating with on-ice performance. While one of two studies found off-ice speed correlated with on-ice speed in elite players [9], the other study found no association between off-ice speed and on-ice agility [17]. There were only a few studies that assessed relationships between repeated sprint ability (RSA), aerobic capacity (i.e. VO2max), and body composition with on-ice performance [2, 7].
Research in Sub-Elite Players
In 2012, correlations were found between jumping performance and on-ice performance in 38 male high school ice hockey players [15]. On-ice performance tests included forward sprint speed over 34.5 meters, left/right crossovers, and left/right short radius turns. Off-ice 40-yard sprint could be used to predict on-ice forward skating speed over 34.5-m, as the off-ice sprint time accounted for a whopping 65% of the variance observed in forward skating sprint time. Other measured off-ice variables, including both single and double-limb vertical and broad jumps, as well as side-to-side skater jumps, were moderately correlated with on-ice performance, but could not be used to predict subsequent on-ice performance [15]. Of all the jumping tasks, the single-leg vertical jump tests had the 2 strongest correlations with on-ice sprint speed. Many of these off-ice metrics were associated with on-ice crossover and short radius turning performance, as well, but did not account for variability in the skating tasks when put through regression analyses [15].
In a study involving 10 players from a men’s Swedish ice hockey team playing in the second highest division in Sweden found no correlations between relative aerobic capacity (VO2max), body composition, or isokinetic knee flexion/extension muscle strength, and on-ice agility, forward acceleration, or speed [10]. It should be noted that absolute aerobic capacity (VO2max) was associated with on-ice acceleration, but when aerobic capacity was normalized to body weight, the association disappeared [10]. No off-ice power metrics were collected in this study.
Janot et al. (2015) compared off-ice and on-ice metrics within a cohort of 26 NCAA Division III ice hockey players (15 males; 11 female), [12]. Body composition, 30-second wingate, off-ice 40-yard sprint, pro agility (5-10-5), vertical jump, 1RM squat, and 1.5 mile run performances were investigated. Vertical jump and off-ice 40-yard sprint were both significant predictors of the fastest trial in the Reed repeat skate sprint test. Vertical jump, 40-yard sprint, and 1.5-mile run were all significant predictors of average repeated skate time. Finally, vertical jump was also associated with straight-ahead on-ice sprint speed over 44.8-m [12].
In 36 male competitive hockey players (10+ years experience; 15-22 years old), Farlinger et al. (2007) observed significant associations between off-ice variables and on-ice forward sprint over 35-m [13]. Athletes from a wide range of playing levels were included, ranging from Bantam AA to NCAA players with Major Junior experience. The best predictors of on-ice sprint speed were (r > 0.74): off-ice 30-m sprint (0.78), 3-hop broad jump (0.78), and single broad jump (0.74). Relative mean power (0.73) and peak power during a modified 15-second wingate (0.71), vertical jump (0.71), and wingate absolute mean power (0.71) were also strongly correlated. Maximum number of push-ups (0.60), and and off-ice agility test termed the Edgren side shuffle (0.55) were moderately correlated with on-ice speed, whereas the Hexagon agility test (0.01) and side plank performance (0.38) were not. Combined playing level, body weight, off-ice 30-m sprint, and 3-hop broad jump, could predict 78.1% of the variance in on-ice skating sprint performance [13].
In 30 secondary school and junior-level hockey players, Behm et al. (2005) found a strong association between off-ice 40-yard sprint performance on maximum skating speed [16]. Contrary to many other reports, squat jump and 1RM leg press performances did not show association with on-ice speed.
Summary of Research in Sub-Elite Players
There are clear similarities between elite and subelite cohorts regarding off-ice and on-ice performance correlations. Similar to findings in elite cohorts, off-ice power metrics measured in sub-elite players, such as vertical jump [12, 13, 15], broad jump [13, 14], and off-ice sprint [12, 15, 16] were associated with on-ice performance. Absolute aerobic capacity (VO2max), but not relative aerobic capacity (VO2max), body fat percentage, or isokinetic knee flexion/extension strength were associated with on-ice performance in one study of sub-elite cohorts [10].
Complete Summary of Off-Ice and On-Ice Performance Correlates
Forward skating acceleration can be crucial to a player’s success on the ice. Players with faster starts are more likely to create beneficial opportunities for their team that contribute to winning. For example, players who excel at acceleration are more likely to win races to the puck, outmaneuver their opponents, and achieve tactical separation from defensive players.
Producing lower body power, both horizontally and vertically, appears to be the biggest contributor to on-ice speed. In the literature, off-ice sprint, and multi-directional jumps are frequently used tests evaluating this component of fitness. Another appropriate consideration for testing is lower body strength, as it’s a prerequisite to power production. Heavy squatting is the most frequently used measure of lower body strength evaluation in the analyzed research. Body composition and off-ice aerobic capacity don’t appear to be as relevant for skating speed.
2. Correlations Between Off-Ice Performance and On-Ice Success
There appears to be a significant difference in on-ice acceleration [18, 19] and speed [20-23] between high-caliber and low-caliber ice hockey players. There are likely many contributors to these differences, including faster stride rates, and greater degrees of knee flexion, hip flexion, and ankle dorsiflexion during on-ice acceleration [18, 24-26]. Despite being quite a simple notion, the evaluation of on-ice power production is a valuable aspect given its potential to segregate higher quality from lower quality players. Although skating acceleration and speed are undoubtedly essential components of a successful ice hockey player, there are a plethora of other fitness-related variables that contribute to on-ice success, including size, strength, conditioning, coordination, and movement quality. As opposed to the previous section, which evaluated correlations between off-ice fitness and on-ice performance, this section focuses on correlations between off-ice fitness and on-ice success.
Research in NHL Players and the NHLED Combine
Research studies with the largest cohorts comparing off-ice capabilities with ice hockey success use data from the NHL Entry Draft (NHLED) Combine and Draft [27-29]. Smaller-scale studies involving elite overseas [21-23, 30] and NCAA players [20, 31-33] will be discussed later.
The NHL Entry Draft (NHLED) Combine
Every June, the top 110–120 players worldwide are invited to the NHLED Combine, where they participate in a battery of off-ice tests designed to assess players’ hockey-related fitness. These tests, which were all believed to be possible predictor variables at some point in time, include the Wingate 30-second anaerobic power test (peak watts and fatigue index), aerobic capacity (relative VO2max), body composition (physician-rated physical development, height, weight, body fat percentage), grip strength, bench press, sit-ups, push-ups, standing long jump (i.e. broad jump), vertical jump leg power, upper-body power, flexibility, and isometric push and pull force. These specific measures were chosen for test inclusion based on the expert opinion of a group of exercise physiologists, with feedback from NHL scouts and strength and conditioning staffs. The specific tests included in the testing battery have changed over time, but the general hockey-related fitness variables of interest have remained relatively consistent.
Research From the NHLED Combine
Off-ice data from the NHLED Combine was compared with Draft Selection Order in 250 players between 2001-2003 [27]. Although this study shouldn’t be discounted from the big picture, I choose to not include its findings in my analysis due to a few glaring limitations, which could have severely impacted its findings. First, all 3 years of data were analyzed separately, limiting the sample size of each analysis. Second, all playing positions, including skaters (forwards and defensemen) and non-skaters (goalies) were examined together. Although skating players are sometimes analyzed together, it’s an uncommon procedure to include goalies in the group of players due to the drastic physiological requirements of that position, relative to the skating players. Using nearly a decade of NHLED Combine data, it was discovered that forwards and defensemen are significantly more developed than goalies, further supporting the notion that the physical demands of goaltending are different than those for skating players [29].
Burr and colleagues (2008) later evaluated 8 years of NHLED Combine data in aggregate from a total of 853 players [29]. In skaters (non-goalies), 7% of the variance in draft order could be explained by combined wingate peak power, wingate fatigue rate, broad jump distance, and body index [29]. Body index was a custom score derived from a player’s combined height, lean body mass, and physician-rated physical development [29]. When segregating forwards from defensemen, the relative importance of body index increased for forwards, while wingate peak power and fatigue index become more important for defensemen, compared with the regression model combining the two positional groups [29]. Vertical jump height and aerobic capacity (VO2max) (among other performance metrics) were not significant predictors of draft order (i.e. on-ice success), in this study.
A very different approach was taken in another NHLED Combine analysis using 4 years of data including 345 athletes [28]. Combine metrics were separated into 4 categories: 1) upper body strength, 2) lower body power, 3) body composition, and 4) energy systems. These fitness categories were compared with the propensity of successful transition to the NHL; defined as playing 5+ games within a 4-year period after the NHL Draft. The 4 fitness categories were compiled into a total fitness score, called the composite physical fitness index (CPFI). The authors found that defensemen scoring at the 80th percentile on the CPFI had almost 70% probability of playing 5+ games in the NHL within 4 years after the draft [28]. Forwards scoring in the 80th percentile had a 50% chance. When they had scores on the CPFI at the 90th percentile, probabilities of playing 5+ games in the NHL within the next 4 years for defensemen and forwards were 72% and 61%, respectively [28]. Although it’s difficult to determine which physical attributes contributed the most, these results suggest that analysis of physical fitness indicators, in general, can be used to help predict NHL success.
Research in NHL Players from a NHL Training Camp
The following data set is unpublished, and is from a team’s NHL Training Camp in 2014. It compares the performances from positional players only (Forwards and Defensemen) at the 2014 NHL Training Camp with subsequent games played in the following 4 seasons (2014-15 through 2017-18).
There are a few moderate-strong correlations to note. Players with faster on-ice sprints (30 meters) played in more NHL games in the following 4 seasons, compared with players with slower sprinting speeds. Players who performed better on an on-ice conditioning test (6x 25-30s bouts with 90s rest in between), played more subsequent NHL games during that period, as well. Broad jump distance and pull-ups had weak-moderate relationships with subsequent games played, and vertical jump height was right on the cusp of being in this category. The data is below:

It gets more interesting. I then took all players who played less than 100 subsequent games out of the equation to get a sense for what variables may segregate high-caliber from truly elite players. In this data set, there was a moderate-strong association between vertical jump height and subsequent games played in the following 4 seasons. Broad jump distance had a weak-moderate relationship. Interestingly, the on-ice performance metrics (conditioning and sprint speed) didn’t contribute to nearly as much of the variance as it had in the data set including all Training Camp players. Body fat percentage had weak-moderate INVERSE relationship with games played in the elite group of players. The data is below:

One may postulate that on-ice speed and skating ability (partially exemplified by the on-ice conditioning test) can bring a hockey player to a high level of success, but as players become more skilled, the on-ice skating ability of the cohort differs less and less. At that point, perhaps off-ice variables, particularly those related to power production (vertical jump, broad jump), become more crucial to optimal on-ice performance.
Research in Elite Leagues from Overseas
In 2013, Roczniok and colleagues conducted off-ice and on-ice testing on 60 adolescent male Polish players (15-16 years old) competing to make a junior National Team of Poland [23]. Comparisons were made between players who did vs. those who did not make the team. Relative wingate peak power was a significant predictor for team selection; players that were selected for the team had higher relative wingate peak power than those that were not selected. Although the differences between groups were not statistically significant, the players who were selected for the team had faster 30-m forward and backward on-ice sprint times. There were no differences in VO2max (bike) or body fat percentage between the players who made the team and the players who were cut [23].
The same research group did a similar experiment in 42 slightly older Polish players (average age = 24.7) competing for a team that played in the top division of Polish ice hockey league [22]. Relative wingate peak power, time to peak power, relative total wingate work, body fat percentage, and relative VO2max (bike) were off-ice variables associated with team selection. Better on-ice performances during forward skating, repeated high-intensity conditioning, and turning and stop-start tests, were also associated with team selection [22]. Of these associations, only relative wingate peak power, time to peak power, relative VO2max, and on-ice 30-m forward sprint predicted team selection in the applied statistical model.
In a study of 18 elite (17-35 years old) and 21 elite junior players (16-19 years old) from the Trondheim Ice-Hockey Club (Norway), significant differences between players were observed [30]. Elite players were roughly 7 years older and 12 kg heavier than the elite junior players, on average. Elite players had higher 1RM squat and 1RM bench (both absolute, and relative), higher absolute VO2max (bike), faster off-ice 10-m sprint, and better vertical jumping performances than the elite junior players [30]. Interestingly, there were no differences in relative VO2max, off-ice 40-meter sprint times, or body fat percentage between groups [30].
In 1980, off-ice and on-ice physiological data was collected from the Canadian Olympic Hockey team [21]. Their on-ice 30-meter sprint times were faster than lower-tiered Junior A-level counterparts [21]. Aerobic capacity (VO2max) values were lower than some elite teams, similar to others, and lower than Canadian College Hockey players [21].
Research in NCAA Players
Using data from 120 male NCAA Division I players (Cornell University) over 14 consecutive seasons (2001-2015), comparisons were made between off-ice variables and games played [31]. Body fat percent, vertical jump, and bench press (# of reps with 225 lbs) were tested at the beginning of each season. Vertical jump and bench press performance, but not body fat percentage, were associated with games played in this cohort [31].
In 2007, off-ice metrics were compared with on-ice in-game performance (+/- rating) in the men’s NCAA Division I ice hockey championship team (24 players), [32]. Off-ice metrics included body fat percentage, VO2max (treadmill), off-ice repeated sprint performance (12×110-m sprints with 45s rest in between each), and as many repetitions as possible for leg press (using 400lb), bench press (using 155lb), chin ups, and push-ups. Performances of off-ice repeated sprint, chin-ups, leg press, and bench press were each significantly correlated with the player’s absolute +/- rating. When ranked among the team, only off-ice repeated sprint (12×110-m) and leg press ranks were associated with +/- rank [32]. Coaches also rated their players as a unique way of quantifying a player’s hockey skill/performance. The top 6 coach-rated players tended to be younger, heavier, faster in the 12×110-m repeat sprint, and perform better on the leg press [32]. The repetition ranges for bench press and leg press were 19-22 and 25-33 repetitions, respectively. Thus, these can be considered muscular endurance tests rather than muscle strength tests. When the variables significantly correlated with +/- rating were integrated into regression analysis, chin-ups and repeat sprint performance emerged as the best predictors of +/- rating, accounting for 49% of the variance. Of note, VO2max (treadmill) and body fat percentage were not related to +/- or coach rating, in any capacity.
In a study by Peterson et al. (2015), off-ice and on-ice performance of 45 collegiate and junior-level male hockey players (18-24 years old) were analyzed. NCAA Division I and junior-level players had higher vertical jump, wingate peak power, wingate fatigue index, grip strength, and lower body fat percentages, compared with their NCAA Division III counterparts [20]. VO2max and wingate mean power were the only relevant off-ice measures that didn’t significantly differ between groups. Additionally, Division I and junior-level players had faster on-ice top-speeds and on-ice course times (fastest course time; slowest course time; average course time) during an on-ice non-linear repeated sprint test (i.e. Peterson test; 8 x 20-25s sprints with 90s rest in between each), compared with Division III players [20].
Quantifying the number of chances a player has to score goals is a common method for quantifying on-ice performance. In a study involving 29 NCAA Division I athletes, Green et al. (2006) compared pre-season body fat percentage and VO2max (treadmill) with scoring opportunities in the subsequent season [33]. Players’ aerobic capacities (VO2max), but not body fat percentages, were associated with increased scoring opportunities [33].
Complete Summary of Off-Ice Performance and On-Ice Success Correlates
Elite players are consistently faster on-ice [20-23] and off-ice [30, 32] compared with their lower-tiered counterparts. Off-ice power exhibited via jumping performance appears to be an important contributor to elite status in ice hockey as well [20, 30, 31], but this is not always the case [29]. In light of the relationships between lower body power and skating speed mentioned previously [7-9, 12, 13, 15], lower body power is perhaps the best off-ice predictor of on-ice success. Considering the observed relationships between the wingate test (mainly the relative mean and peak power metrics) [20, 22, 23, 29], heavy squatting [30], leg press performances [32], and on-ice success, lower body strength is also a likely contributor to elite status. While aerobic capacity (VO2max) and body fat percentage are frequently measured, their contributions to elite ice hockey performance are questionable. Some research reports associations between these metrics and higher-level on-ice success [20, 22, 33], whereas the majority of research does not [20, 23, 30-33]. Although it’s clear that multiple off-ice performance facets contribute to on-ice success [28], it’s also clear that some components are more important than others; overall, on-ice speed and acceleration, off-ice speed, lower body power, and lower body strength appear to be the best indicators of on-ice performance and success.
A Special Note on Aerobic Capacity (VO2max)
Although the research on the association between aerobic capacity (VO2max) and on-ice performance is mixed, the contribution of aerobic metabolism to recovery between shifts and periods is well known [1, 34]. On-ice success at the elite level requires players to develop a well-rounded fitness level that includes anaerobic sprint ability, as well as a strong aerobic endurance base (i.e. VO2max), [34-40]. It’s my contention that developing a high aerobic capacity is important for on-ice success. However, I believe that once a high aerobic capacity is attained, between 50-60 ml/kg/min, continuing to focus on aerobic development offers no additional benefit, and may even detract from overall physiologic capabilities. This notion is supported by Twist and Rhodes (1993) who report that elite ice hockey forwards and defensemen require an aerobic capacity (VO2max) of 60 ml/kg/min and 50 ml/kg/min, respectively [40].
The different methodologies used to assess aerobic capacity (VO2max) may play a role in the mixed associations between VO2max and on-ice performance observed in the literature. Lack of agreement between on-ice and off-ice aerobic capacity (VO2max) values have been reported previously [1, 5, 7, 41].
For example, on-ice testing appears to be more accurate in ice hockey players since it elicits higher VO2max values when compared with VO2max testing on a bike [5]. There are reports of stronger correlations between on-ice and off-ice VO2max when the off-ice test is performed on running treadmill [32] or a skating treadmill [1], instead of the bike. When comparing VO2max values between running and skating treadmills, a study in male high school hockey players reported higher VO2max values from the running treadmill [42]. Confounding the data even more, it has been reported that a significant correlation between VO2max in the laboratory and aerobic skating doesn’t exist [43].
It’s possible that the degree of skating experience and comfortability plays a role in its applicability for estimating true aerobic capacity. In fact, a player with low skating efficiency may be more prone to on-ice fatigability than a player with low VO2max [44]. Using the results from three subjects who were representative of elite hockey players, Green (1979) reported that at various skating speeds, the player with the lowest VO2max expended the least energy in skating at those velocities. The ability of that player to maintain skating intensity at high velocities was far superior to the other two players who attained superior VO2max values [44]. Leger et al. (1979) also found that hockey players were 15% more efficient on the ice and 8% less efficient on the treadmill, whereas running athletes were more efficient on the treadmill [45].
The results from laboratory-derived VO2max testing may give inaccurate information concerning an ice hockey player’s ability to perform aerobic skating; capacity to perform anaerobically and aerobically on the ice is substantially more important, and sometimes unrelated, to the ability to attain a high aerobic capacity (VO2max) off the ice. Theoretically, a player with great stride efficiency (i.e. great skater) but a low on-ice aerobic capacity (i.e. poor aerobic fitness) has the potential to reach the same level of on-ice aerobic capacity test performance as a player with poor stride ef?ciency (i.e. poor skater) and a high aerobic capacity (i.e. great aerobic fitness).
It’s my opinion that (1) performing VO2max testing on-ice, and (2) quantifying physiological outputs during testing, whether it be via heart rate, accelerometry, or another means, is an appropriate strategy for determining both aerobic fitness/capacity (i.e. VO2max) and skating efficiency in ice hockey athletes.
Practical Applications
Unfortunately, there’s not a whole lot of research investigating relationships between physical off-ice attributes and on-ice prowess, particularly in elite cohorts. Additionally, within the research that has been conducted, there are extreme variations among the demographics investigated, physical qualities tested, and methodologies used. It’s incredibly important to understand that my evidence-based opinions are formed mainly on this lackluster body of research, but also include my internal analyses of data sets in high-caliber hockey players, and my anecdotal observations in this cohort.
From my interpretation of the research, on-ice speed and acceleration appear to be the most consistent factors segregating the elite from sub-elite ice hockey players. In descending order of importance, the following attributes appear to be associated with on-ice speed and acceleration, or contribute to the segregation of elite vs. non-elite players: off-ice speed, lower body power (i.e. vertical and broad jumps), lower body strength (i.e. heavy squatting, wingate relative mean and peak power), and aerobic capacity (VO2max; ml/kg/min). Despite infrequent evaluation, the minute body of research on upper body strength (i.e. bench press, push-ups, chin-ups, and grip strength) may contribute to on-ice performance. In contrast, although body fat percentage is frequently evaluated in the research, it seldom correlates with on-ice prowess. Other physical attributes, such as off-ice agility and core strength, are not frequently evaluated. Therefore, the potential relationship between these physical attributes and on-ice performance is very difficult to determine.
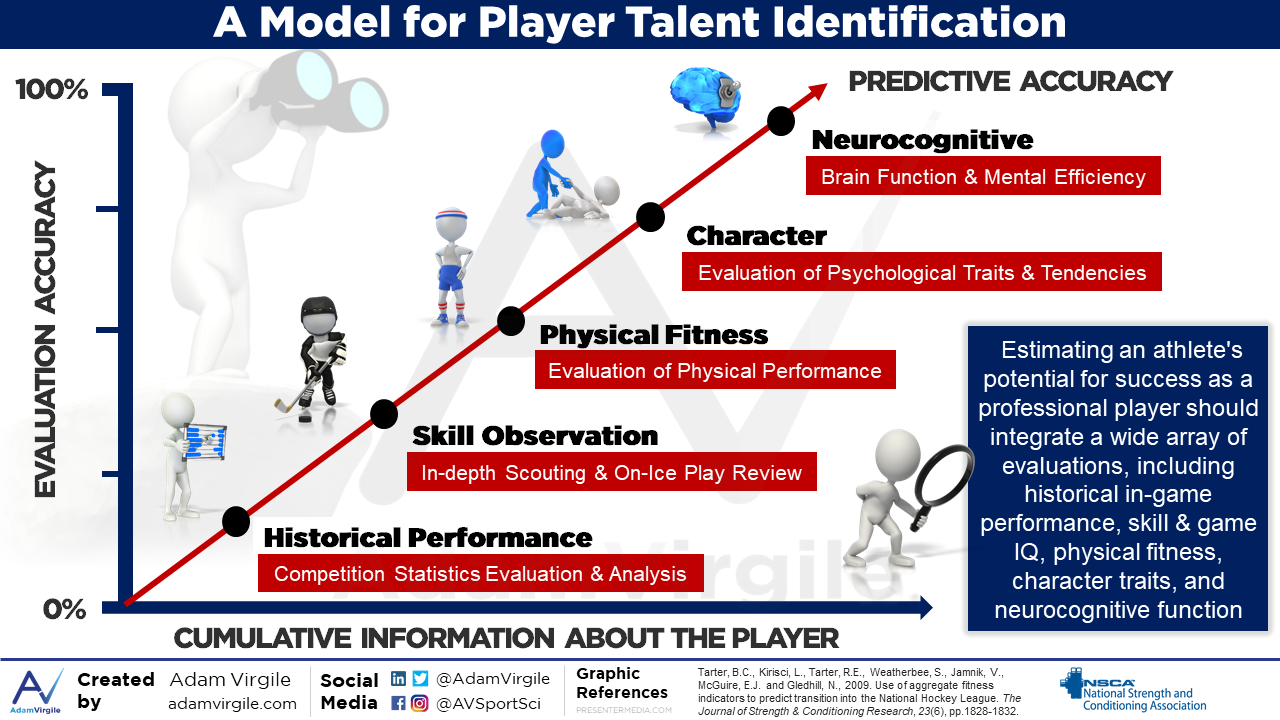
The contributing components to ice hockey elitism are undoubtedly vast and variable. Although this review focuses on physical attributes, it’s important to understand that these qualities are only a minute piece of the big picture. When also considering genetic, psychological, hockey sense, and skill-related factors, it becomes clear that the physical attributes that may contribute to on-ice performance only make up a small portion of the complete ice hockey player. In their integrative NHL player talent identification model, Tarter et al. (2009) reiterate this notion when they suggest that evaluation of physical fitness plays a role, but is not the only component necessary for optimal NHL talent identification [28]:
Reference
- Peterson, B.J., Fitzgerald, J.S., Dietz, C.C., Ziegler, K.S., Ingraham, S.J., Baker, S.E. and Snyder, E.M., 2015. Aerobic capacity is associated with improved repeated shift performance in hockey. The Journal of Strength & Conditioning Research, 29(6), pp.1465-1472.
- Lignell, E., Fransson, D., Krustrup, P. and Mohr, M., 2018. Analysis of High-Intensity Skating in Top-Class Ice Hockey Match-Play in Relation to Training Status and Muscle Damage. The Journal of Strength & Conditioning Research, 32(5), pp.1303-1310.
- Mascaro, T., Seaver, B.L. and Swanson, L., 1992. Prediction of skating speed with off-ice testing in professional hockey players. Journal of Orthopaedic & Sports Physical Therapy, 15(2), pp.92-98.
- Peterson, B.J., Fitzgerald, J.S., Dietz, C.C., Ziegler, K.S., Baker, S.E. and Snyder, E.M., 2016. Off-ice anaerobic power does not predict on-ice repeated shift performance in hockey. The Journal of Strength & Conditioning Research, 30(9), pp.2375-2381.
- Durocher, J.J., Guisfredi, A.J., Leetun, D.T. and Carter, J.R., 2010. Comparison of on-ice and off-ice graded exercise testing in collegiate hockey players. Applied Physiology, Nutrition, and Metabolism, 35(1), pp.35-39.
- Potteiger, J.A., Smith, D.L., Maier, M.L. and Foster, T.S., 2010. Relationship between body composition, leg strength, anaerobic power, and on-ice skating performance in division I men’s hockey athletes. The Journal of Strength & Conditioning Research, 24(7), pp.1755-1762.
- Daehlin, T.E., Haugen, O.C., Haugerud, S., Hollan, I., Raastad, T. and Rønnestad, B.R., 2017. Improvement of Ice Hockey Players’ On-Ice Sprint With Combined Plyometric and Strength Training. International journal of sports physiology and performance, 12(7), pp.893-900.
- Edman, S. and Esping, T., 2013. Squats as a predictor of on-ice performance in ice hockey.
- Runner, A.R., Lehnhard, R.A., Butterfield, S.A., Tu, S. and O’Neill, T., 2016. Predictors of speed using off-ice measures of college hockey players. The Journal of Strength & Conditioning Research, 30(6), pp.1626-1632.
- Gilenstam, K.M., Thorsen, K. and Henriksson-Larsén, K.B., 2011. Physiological correlates of skating performance in women’s and men’s ice hockey. The Journal of Strength & Conditioning Research, 25(8), pp.2133-2142.
- Bracko, M.R. and George, J.D., 2001. Prediction of Ice Skating Performance With OffIce Testing in Women’s Ice Hockey Players. The Journal of Strength & Conditioning Research, 15(1), pp.116-122.
- Janot, J.M., Beltz, N.M. and Dalleck, L.D., 2015. Multiple off-ice performance variables predict on-ice skating performance in male and female division III ice hockey players. Journal of sports science & medicine, 14(3), p.522.
- Farlinger, C.M., Kruisselbrink, L.D. and Fowles, J.R., 2007. Relationships to skating performance in competitive hockey players. Journal of Strength and Conditioning Research, 21(3), p.915.
- Henriksson, T., Vescovi, J.D., Fjellman-Wiklund, A. and Gilenstam, K., 2016. Laboratory-and field-based testing as predictors of skating performance in competitive-level female ice hockey. Open access journal of sports medicine, 7, p.81.
- Krause, D.A., Smith, A.M., Holmes, L.C., Klebe, C.R., Lee, J.B., Lundquist, K.M., Eischen, J.J. and Hollman, J.H., 2012. Relationship of off-ice and on-ice performance measures in high school male hockey players. The Journal of Strength & Conditioning Research, 26(5), pp.1423-1430.
- Behm, D.G., Wahl, M.J., Button, D.C., Power, K.E. and Anderson, K.G., 2005. Relationship between hockey skating speed and selected performance measures. The Journal of Strength & Conditioning Research, 19(2), pp.326-331.
- Haukali, E. and Tjelta, L.I., 2015. Correlation between “off-ice” variables and skating performance among young male ice hockey players. International Journal of Applied Sports Sciences, 27(1), pp.26-32.
- Buckeridge, E., von Tscharner, V. and Nigg, B.M., 2016, May. LOWER LIMB MUSCLE RECRUITMENT STRATEGIES DIFFER BETWEEN ELITE AND RECREATIONAL ICE HOCKEY PLAYERS. In ISBS-Conference Proceedings Archive (Vol. 33, No. 1).
- Renaud, P.J., Robbins, S.M., Dixon, P.C., Shell, J.R., Turcotte, R.A. and Pearsall, D.J., 2017. Ice hockey skate starts: a comparison of high and low calibre skaters. Sports Engineering, 20(4), pp.255-266.
- Peterson, B.J., Fitzgerald, J.S., Dietz, C.C., Ziegler, K.S., Ingraham, S.J., Baker, S.E. and Snyder, E.M., 2015. Division I hockey players generate more power than division III players during on-and off-ice performance tests. The Journal of Strength & Conditioning Research, 29(5), pp.1191-1196.
- Smith, D.J., Quinney, H.A., Steadward, R.D., Wenger, H.A. and Sexsmith, J.R., 1982. Physiological profiles of the Canadian Olympic Hockey Team (1980). Canadian journal of applied sport sciences. Journal canadien des sciences appliquees au sport, 7(2), pp.142-146.
- Roczniok, R., Stanula, A., Maszczyk, A., Mostowik, A., Kowalczyk, M., Fidos-Czuba, O. and Zaj?c, A., 2016. Physiological, physical and on-ice performance criteria for selection of elite ice hockey teams. Biology of sport, 33(1), p.43.
- Roczniok, R., Maszczyk, A., Stanula, A., Czuba, M., Pietraszewski, P., Kantyka, J. and Starzy?ski, M., 2013. Physiological and physical profiles and on-ice performance approach to predict talent in male youth ice hockey players during draft to hockey team. Isokinetics and Exercise Science, 21(2), pp.121-127.
- Upjohn, T., Turcotte, R., Pearsall, D.J. and Loh, J., 2008. Three-dimensional kinematics of the lower limbs during forward ice hockey skating. Sports biomechanics, 7(2), pp.206-221.
- Marino, G.W., 1983. Selected mechanical factors associated with acceleration in ice skating. Research quarterly for exercise and sport, 54(3), pp.234-238.
- De Koning, J.J., Thomas, R., Berger, M.O.N.I.Q.U.E., De Groot, G. and van Ingen Schenau, G.J., 1995. The start in speed skating: from running to gliding. Medicine and science in sports and exercise, 27(12), pp.1703-1708
- Vescovi, J.D., Murray, T.M., Fiala, K.A. and VanHeest, J.L., 2006. Off-ice performance and draft status of elite ice hockey players. International journal of sports physiology and performance, 1(3), pp.207-221.
- Tarter, B.C., Kirisci, L., Tarter, R.E., Weatherbee, S., Jamnik, V., McGuire, E.J. and Gledhill, N., 2009. Use of aggregate fitness indicators to predict transition into the National Hockey League. The Journal of Strength & Conditioning Research, 23(6), pp.1828-1832.
- Burr, J.F., Jamnik, R.K., Baker, J., Macpherson, A., Gledhill, N. and McGuire, E.J., 2008. Relationship of physical fitness test results and hockey playing potential in elite-level ice hockey players. The Journal of Strength & Conditioning Research, 22(5), pp.1535-1543.
- Hoff, J., Kemi, O.J. and Helgerud, J., 2005. Strength and endurance differences between elite and junior elite ice hockey players. The importance of allometric scaling. International Journal of Sports Medicine, 26(07), pp.537-541.
- Kniffin, K.M., Howley, T. and Bardreau, C., 2017. Putting Muscle Into Sports Analytics: Strength, Conditioning, and Ice Hockey Performance. The Journal of Strength & Conditioning Research, 31(12), pp.3253-3259.
- Peyer, K., Pivarnik, J.M., Eisenmann, J.C. and Vorkapich, M., 2010. Fitness Characteristics of Ncaa Division I Ice Hockey Players and Their Relation to Game Performance: 1092. Medicine & Science in Sports & Exercise, 42(5), p.158.
- Green, M.R., Pivarnik, J.M., Carrier, D.P. and Womack, C.J., 2006. Relationship between physiological profiles and on-ice performance of a National Collegiate Athletic Association Division I hockey team. Journal of Strength and Conditioning Research, 20(1), p.43.
- Lau, S., Berg, K., Latin, R.W. and Noble, J., 2001. Comparison of active and passive recovery of blood lactate and subsequent performance of repeated work bouts in ice hockey players. Journal of Strength and Conditioning Research, 15(3), pp.367-371.
- Cox, M.H., Miles, D.S., Verde, T.J. and Rhodes, E.C., 1995. Applied physiology of ice hockey. Sports medicine, 19(3), pp.184-201.
- Green, D.J., Maiorana, A., O’driscoll, G. and Taylor, R., 2004. Effect of exercise training on endothelium?derived nitric oxide function in humans. The Journal of physiology, 561(1), pp.1-25.
- Seliger, V., Kostka, V., Grušová, D., Ková?, J., Machovcova, J., Pauer, M., P?ibylová, A. and Urbankova, R., 1972. Energy expenditure and physical fitness of ice-hockey players. Internationale Zeitschrift für Angewandte Physiologie einschließlich Arbeitsphysiologie, 30(4), pp.283-291.
- Montgomery, D.L., 1988. Physiology of ice hockey. Sports medicine, 5(2), pp.99-126.
- Twist, P. and Rhodes, T., 1993. Exercise physiology: A physiological analysis of ice hockey positions. Strength & Conditioning Journal, 15(6), pp.44-46.
- Twist, P. and Rhodes, T., 1993. Exercise physiology: The bioenergetic and physiological demands of ice hockey. Strength & Conditioning Journal, 15(5), pp.68-70.
- Buck, D., 2013. Seasonal changes in various performance measurements in ice-hockey players.
- Koepp, K. and Janot, J., 2006. A Comparison of Vomax and Metabolic Variables between Treadmill Running and Treadmill Skating. Medicine & Science in Sports & Exercise, 38(5), p.S512.
- Brayne, S., 1985. A comparison of on-ice and laboratory tests of ice hockey fitness (Doctoral dissertation, McGill University).
- Green, H.J., 1979. Metabolic aspects of intermittent work with specific regard to ice hockey. Canadian journal of applied sport sciences. Journal canadien des sciences appliquees au sport, 4(1), pp.29-34.
- Leger, L., Seliger, V.A.C.L.A.V. and Brassard, L., 1979. Comparsions among VO2 max values for hockey players and runners. Canadian journal of applied sport sciences. Journal canadien des sciences appliquees au sport, 4(1), pp.18-21.
Want to be the first to know when new content is created? Please enter your email address below.